Back in July, we wrote about network effects in marketplaces and social platforms and how…
Data / AI / ML, Entrepreneurship, Marketplaces / Social / Collaboration / Network Effects
One of the first blog posts that Boris shared with me when I was starting out is “Don’t forget your logged out users” by Fred Wilson. Fred notes that with many social platforms, a huge number of their regular users don’t actually login because they are able to derive value from their services on a “logged […]
Back in July, we wrote about network effects in marketplaces and social platforms and how…
Back in 2014, I blogged about building a user engagement pyramid for social platforms, inspired by…
One of the first blog posts that Boris shared with me when I was starting out is “Don’t forget your logged out users” by Fred Wilson. Fred notes that with many social platforms, a huge number of their regular users don’t actually login because they are able to derive value from their services on a “logged out basis”. As a result, he advises entrepreneurs to build services for those users that lead to more engagement, ultimately motivating them to log in.
But what happens once someone logs in?
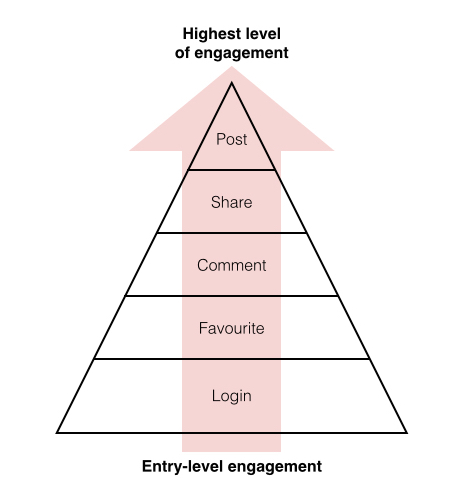
Fred describes the general 100/10/1 rule as applied to social platforms, where 1% of users will create content, 10% will engage with it, and 100% will consume it once they are logged in. This thinking inspired me to come up with a framework for a user engagement pyramid that I have been encouraging our portfolio founders to create for themselves.
Too often, we are presented with a collection of acronyms: LTV, CAC, ARPU, MRR, GMV, etc. While these metrics provide a high-level view of the business, we know that they are vanity measures, symptomatic of what is going on behind the scenes. Instead, I like focusing on the core factors that drive the KPIs above.
Take a few seconds to think about it. What is the most important number to your business? What is the user activity or behaviour that you consider to be a measure of your success?
What is the user engagement pyramid?
You can create one in two steps:
For example, if we were to take a social network like Facebook or Twitter, we might end up with something that looks like the diagram below (n.b. I’ve tried to present this in the most generic way possible). Social networks know that “user-generated content is king”: the most active users (creators) who post status updates, photos, or links are going to drive others to come to the platform time and time again. They also understand that creators continue to be inspired when they are recognized for their contributions via shares, comments, favourites, etc., for their posts. Given this positive feedback loop, it becomes clear that the goal of these social networks is to move a logged in user up the pyramid.
How is this beneficial?
An engagement pyramid grounds your business metrics in something real. It drives home your ultimate user engagement and helps you develop the right processes to get there. By creating one, you can:
Keep in mind this engagement framework can also apply to marketplaces and SaaS companies. For marketplaces, you will probably have two pyramids – one for the buyer and one for the seller – and for SaaS, the pyramid likely maps closely to the sales funnel. In all cases, the idea is to come up with the right framework to quantitatively analyze your user data effectively and efficiently.
I’d love to hear your thoughts and experiences on creating your own engagement pyramid. Feel free to share in the comments below.
Portfolio
We’re a quarter of the way through 2026, and the V1 family is off to a fast start. Across the portfolio, teams are building with urgency, laying the groundwork for what we expect to be another strong year ahead. Before we get too far into Q2, we wanted to take a moment to share a […]
Spring is here, and we’re well into 2022! As always, there’s never a dull moment…
The V1 family kicked off the new year with fresh energy and no shortage of…