In a recent Invest Like The Best podcast, the guest, who goes by the pseudonym…
Marketplaces / Social / Collaboration / Network Effects, Entrepreneurship
I recently caught up with my good friend Bala Subramaniam, who is the Head of Fulfillment at Instacart. You may remember Bala’s talk on supply-demand equilibrium at our data-driven marketplace meetup back in May 2017. Bala is a seasoned product, business, and technology leader. Before Instacart, he was at LinkedIn and Microsoft. I always learn a ton […]
In a recent Invest Like The Best podcast, the guest, who goes by the pseudonym…
Nearly two years ago, we published our first ebook, A Guide to Marketplaces. Towards the…
I recently caught up with my good friend Bala Subramaniam, who is the Head of Fulfillment at Instacart. You may remember Bala’s talk on supply-demand equilibrium at our data-driven marketplace meetup back in May 2017.
Bala is a seasoned product, business, and technology leader. Before Instacart, he was at LinkedIn and Microsoft. I always learn a ton from him and this conversation was no exception. With every insightful thing that Bala said, I kept thinking about how I could share his wealth of knowledge on product, engineering, data, and management with everyone. Luckily, Bala was also wondering how his experience could help others, and how he could do it at scale.
Together, we came up with an idea that I’m excited to launch today: a new blog series “Three Questions with…” (or 3QW for short). Every 6-8 weeks, we’ll bring you an awesome operator from our network, and I’ll ask three questions to learn more about his/her specific work and contributions to his/her organization and community at large.
Hopefully, the discussion will spill over into the comments section – where you can ask any questions and our profiled operator can engage further.
Many thanks to Bala for being our very first guest and sharing his wisdom and expertise on building marketplaces (you’ll soon see – he didn’t hold back!). We hope you enjoy the first installment in this series, especially its depth – with hopefully many more to come.
Without further ado, here are the three questions with Bala Subramaniam…
Question 1: How do you run experiments for product development in a two-sided marketplace?
Bala: Without going into all the details of “Controlled Experimentation”, let’s start with the problem statement that we can’t run traditional A/B experiments in marketplace products. The reason being is that in most marketplaces, we cannot simply split samples by demand or supply since they are all interdependent.
In Instacart’s case, grocery deliveries from the control and treatment variant might be dispatched to the same shopper. And, the orders that one shopper fulfills could affect the assignment of other shoppers.
However, with that said, it is still possible to split samples in a practical fashion. Let’s call each unit of experimentation “EU” (short form for Experiment Unit).
The key is to identify the correct level of granularity you want to experiment with and more importantly, guarantee some form of independence among the EU’s. In the case of Instacart marketplace models, we chose to start with (Zone, Day) as the EU, where “zone” is a segment that operates independently in geographic areas.
For example, it doesn’t make sense to combine an order in San Francisco and an order in Austin into one trip or send a shopper in Austin to deliver in SF. So, by definition, San Francisco and Austin are different zones. In addition, the fulfillment system “clears” overnight as the orders are same-day. Thus, any two days of the same zone are also independent.
This implies that we can split samples by zone and day, and randomly decide which algorithm variant — A for the existing version or B for the new version — to apply based on a schedule. Here is an example of an experiment scheduled for 28 days and 30 zones (total of 840 sample points between control and variant):

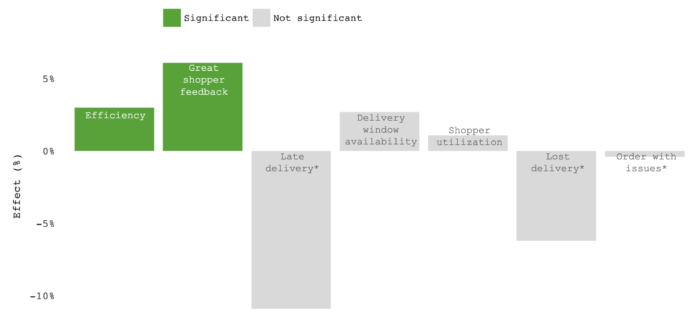
After the experiment is complete, you can measure the differences between the variants to conclude the tests. Below is a sample result of one such experiment:

Want to learn more?
Question 2: What are 1st order and 2nd order effects in marketplaces?
Bala: Most product development happens through controlled experiments. As I mentioned before, marketplace innovation is no exception to this rule, but requires a special approach.
Irrespective of the controlled experiment setup (traditional vs marketplace), most A/B testing only measures 1st order effects. These are metrics that are impacted in the short term as a result of the changes under experimentation, but they don’t have a great line of sight to key business metrics over the long term (ex. LTV).
It is extremely crucial to ensure that with each experiment (or a cluster of changes in a time period…say two quarters), that there aren’t any detrimental 2nd order effects to the key business metrics. Most of the time, the 2nd order effects (Lagging indicator) of the experiments are slow to kick in and they cause issues over a long period (aka. slow death). For this reason, it’s important to keep an eye on the 1st order effect (Leading indicator) which can help us determine if the changes are positively affecting the business metrics in the short term while running controlled experiments.
For example, through a series of experiments, we might have moved some key metrics in a positive direction, but we can’t say if LTV (Supply Lifetime Value) has increased or regressed with the series of changes. So, the first thing to do is to launch a series of analysis to know what is the key metric (Leading indicator) that can help us correlate to LTV (Lagging indicator) in the short term.
For marketplaces like Uber, Instacart, Lyft, Doordash, it can be X units of work in Y days from activation, X$ earned on the platform in Y days since hiring, or X units of work every Y weeks on the platform.
It is extremely important to include these leading indicators in ALL the experiments (even though we can’t think of a reason the change in and of itself will affect the lagging indicator). It is also crucial to ensure we access the causality between the leading and lagging indicator to make sure that the leading indicator chosen is the best proxy for the lagging indicator in the short run. For example, 2X unit of transaction in 3Y days can be more representative than X unit of transaction in Y days.
Over a long period, It might be helpful to have a “Hold-out group” to ensure we normalize the group to the new set of changes every X months and can validate the increased effect of lagging indicators.
Want to learn more?
Question 3: How do you achieve Supply and Demand Equilibrium? Which side do you focus on at first?
Bala: More often than not, the goal of a marketplace is one of two things:
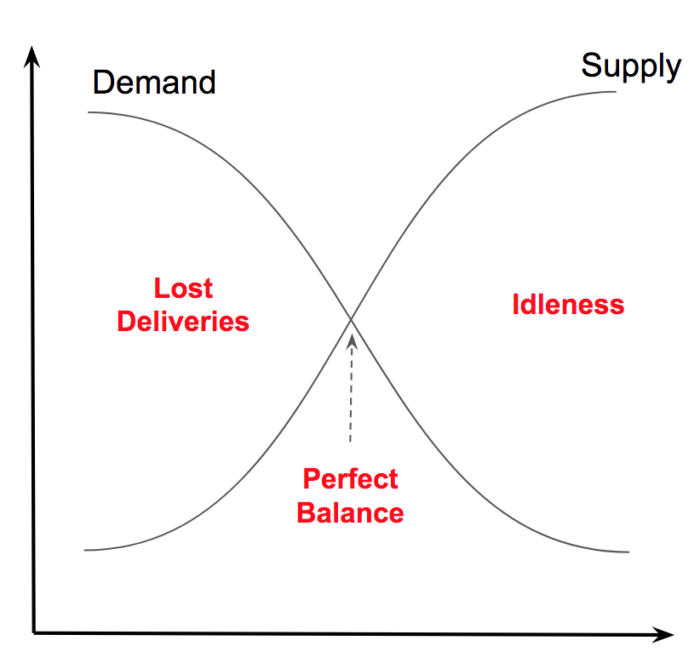
In order to draw efficiency and economic advantage from having a marketplace, it is important for the marketplace to run at equilibrium – and we need to work on optimizing the equilibrium state through a series of product and operational changes.
In marketplaces, the possible states are:
The first order of business is to quantify the supply and demand states as metrics that make the most sense for your business. For example, in the case of ridesharing, X% drivers not getting any ride in Y hours could be the index for supply and X% riders not getting any ride with Y minutes could be the index for demand.
It’s important to define each side independently for the sake of product innovation agility. One lesson that I have learned over the years while working on marketplace dynamics is to never try to move both at the same time. It is much easier and productive to keep one side constant (and at a healthy state) and optimize the other.
This is where we need to do some homework in identifying what we can called as the “Pocket of Goodness”. If we look deep into our marketplace, we will be able to find segments of the marketplace where one side of the marketplace is already healthy whereas the other is not.

Portfolio
It’s been an eventful quarter (when has it not?), and somehow we’ve already crossed the halfway mark of 2025. We wanted to take a moment to highlight just a few of the wins, milestones, and momentum we’ve seen this past quarter. As always, there’s a whole lot happening behind the scenes that can’t be shared […]
The V1 family kicked off the new year with fresh energy and no shortage of…
At the end of Q1, we anticipated that a tech sector slowdown is ideal for…