Last week, we introduced our social platform KPI dashboard to help provide a framework for…
Data / AI / ML, Entrepreneurship, Marketplaces / Social / Collaboration / Network Effects
A few months ago, we wrote about the data we focus on to evaluate marketplaces and later shared a marketplace KPI dashboard that we created to guide founders on the important metrics they should track. As we have been developing our investment thesis on social platforms, we want to provide the similar information and tools. There are […]
Last week, we introduced our social platform KPI dashboard to help provide a framework for…
Over the past two weeks, we have introduced our social platform KPI dashboard to track…
A few months ago, we wrote about the data we focus on to evaluate marketplaces and later shared a marketplace KPI dashboard that we created to guide founders on the important metrics they should track.
As we have been developing our investment thesis on social platforms, we want to provide the similar information and tools.
There are lots of great blog posts and articles out there that talk about social platform metrics. The problem, however, is that these resources are quite fragmented because each social platform is unique in its own way.
In fact, when we use the term “social platforms” at Version One, we’re referring to messaging (e.g. WhatsApp, SnapChat, Facebook Messenger), private social networks (e.g. Facebook, LinkedIn, Shift Messenger), public social networks (e.g. Instagram, Twitter, Figure 1), and communities (e.g. Reddit). With this kind of range, it should come as little surprise that a “one-size-fits-all” analysis simply doesn’t work.
Our aim is to provide a standard framework in which we can think about social platforms… because despite the uniqueness of each individual platform, there are still some commonalities.
Just as we created a KPI dashboard for marketplaces, we built a KPI dashboard for social platforms. We hope this tool helps founders manage their business and preempts those due diligence questions that arise during a fundraise.
You can access the template via the Google doc here (make a copy of it and then you can edit away). Over the course of the next few weeks, we’ll be diving into each section in more detail in a series of blog posts:
Part 1: High-level metrics
Part 2: Measuring engagement by content
Part 3: Measuring engagement by relationships
 Our KPI dashboard for Social Platforms: access the Google spreadsheet here
Part I: High-Level Metrics
First and foremost, social platforms are defined by their engagement so the key metrics to consider are:
Note that the benchmark for “active” can vary: some apps record this when a user simply visits a site while other apps only consider a user to be engaged when s/he logs in and performs another action.
In addition, the total number of active users on your platform at the end of a cycle (i.e. day, week, month) can be viewed as a sum of the following:
Total Users = New Users + Returning Users
From here, you can calculate % new users, % retained users, and % resurrected users relative to the total number of active users. You can also compute growth in these categories, from which you can see how effective your growth, engagement, and re-engagement campaigns are, respectively.
And if you want to understand your retained users deeper, you can break this down in a similar manner, i.e. “new” (i.e. new users in the last cycle who are active this time) + “retained” (i.e. users who continue to be active this cycle as they were previously).
On the flip side of engagement, we can look at churn as a measure of the number of individuals moving out of a collective group over a specific period of time. Churned users can be segmented as follows:
Total Churned Users = New Churned Users + Old Churned Users
Knowing the number of users that have churned allows you to calculate your churn rate.
Churn Rate = # of users churned at end of the time period / # of total users at the beginning of the time period
After we understand engagement and churn, we can perform cohort analysis. Rather than looking at all users as one unit, this breaks them into related groups or cohorts which usually share common characteristics or experiences within a defined timespan.
We won’t recreate the wheel here as our friend, Christoph Janz of Point Nine Capital published a great template on Andrew Chen’s blog. While this is catered to SaaS, the concept is still very relevant to social platforms: substitute “paying customers” with “active users”.
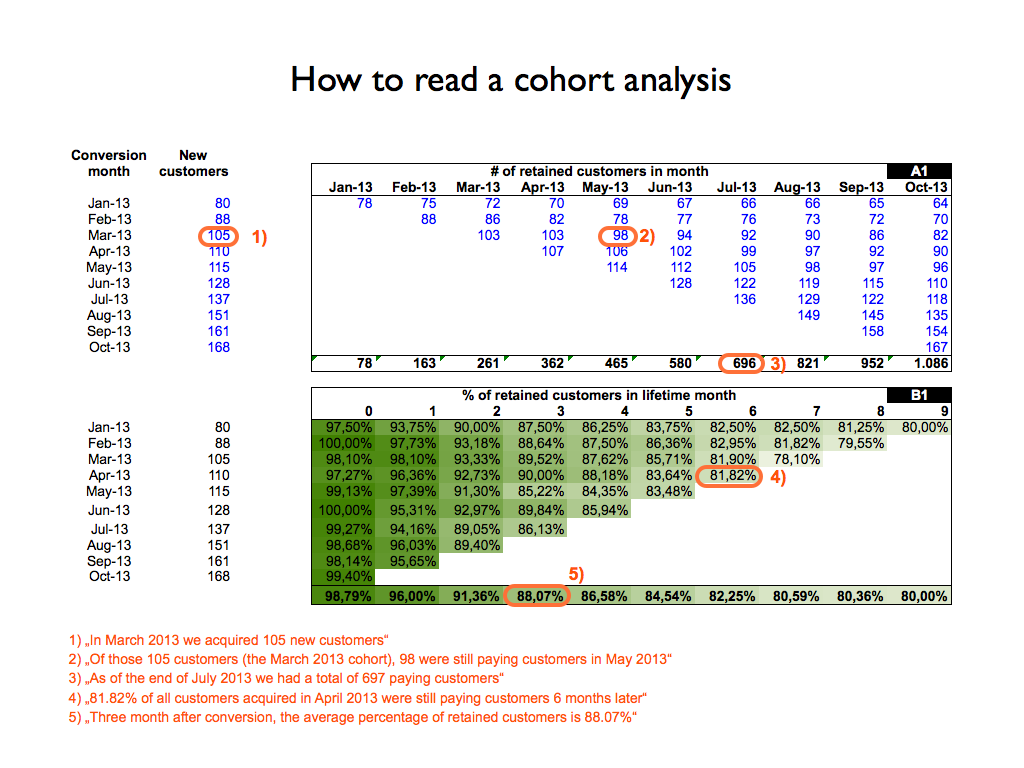
Also, good news! Mixpanel and Google Analytics (and other tools) can automatically create tables for you.
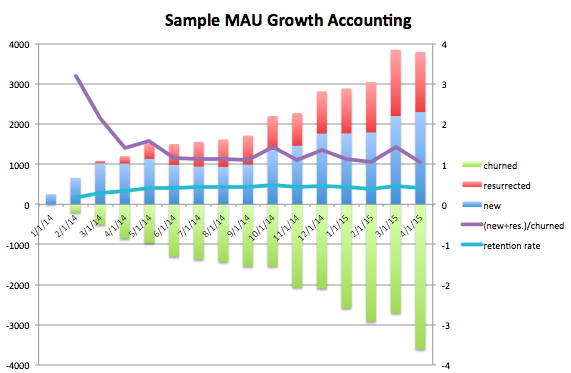
Another great way to understand your data is to visualize it. In fact, last week, my friend Jonathan Hsu wrote about how he and his team at Social + Capital perform due diligence and shared a helpful “growth accounting” graph that summarizes most of the data above.
And finally, for high-level metrics, make sure you track customer acquisition cost (CAC; and how much and what percentage is organic versus paid), net promoter score (NPS), lifetime value (LTV) and average revenue per users (ARPU). The cohort analysis spreadsheet by Christoph helps with this too.
We hope you’ll make a copy of the Social Platforms KPI dashboard, start playing around with your own numbers, and find the process helpful to better understand and measure engagement on the platform you’re building. If you have any questions or thoughts, please start a conversation in the Comments section below. And stay tuned for next week for more details on measuring engagement by content.
Crypto / Blockchain, Portfolio, Version One
We’re excited to announce our investment in Loon, a Canadian company building the country’s first regulated digital dollar. Version One led Loon’s $3M pre-seed round, alongside Garage Capital and a group of strategic Canadian angel investors. Loon is on a mission to create trusted, transparent payment infrastructure for Canada’s digital economy — starting with CADC, […]
As 2015 comes to an end, it’s time to reflect on what we’ve done and…
As the Internet evolves, the venture capital business starts evolving and we have been seeing…