Last week, we introduced our social platform KPI dashboard to help provide a framework for founders to think about their businesses and preempt the inevitable questions that arise during the fundraising process. In the first post, we talked about the high-level metrics to track – such as DAU, MAU, and your stickiness ratio.
In the context of these high-level metrics, the only requirement for a user to be considered “active” is that they somehow engaged with the product. This could be as simple as logging in to the platform once or as engaged as creating content every single day.
This means you need to dive deeper into your users to understand not just the total volume, but also the quality of these users and what it means to be engaged.
Defining engagement on your platform
The first step is to create a list of actions that a user can perform on your platform. Here are some examples of events to record. Note that this is not a comprehensive list nor are all events applicable to every product.
- Account created: when a user creates an account
- Account verified: when a user’s account is successfully verified
- Profile created: when a user creates a profile
- Profile completed: when a user completes his/her profile
- User sign-in: when a user signs onto the platform (note: most platforms now have auto sign-in so users are always logged in)
- User sign-out: when a user signs out of the platform
- Content created: when a user posts text, a url or an image (track this by content type)
- Content viewed: when a user views content
- Content shared: when a user forwards content to others (track this by internal sharing and external sharing)
- Content upvoted: when a user “likes” or “favourites” content created by another user
- Comment added: when a user responds to content created by another user
- Comment upvoted: when a user “likes” or “favourites” another user’s comment to content
- Following: when a user “follows” another user (or content thread)
- Followed: when a user is “followed” by another user
- Connection requested: when a user requests to “friend” another user (in the case where relationships require a double opt-in)
- Connection made: when a user accepts a friend request, or when a user follows another user who follows him/her back
- Group created: when a user creates a group (public or private)
- Membership requested: when a user asks to join a group
- Membership granted / group joined: when a user successful joins a group
- Message sent: when a user sends a message to another user (you can also separate public and private messages)
Once you have this list, you can create a framework of engagement. I previously described the concept of an engagement pyramid which organizes a user’s behaviour in a hierarchy. Recall:
- At the top, place the activity that you determine to be a sign of someone who is most engaged with your product. Typically, this is the factor driving your most important metrics.
- Next, consider all the other activities that someone can do, and place them in decreasing order from what is the hardest / has the most friction for someone to do / requires the most energy, to what is easiest.
By doing this, you can identify the highest level of user engagement and subsequently, allocate resources to achieve that outcome.
While not obvious, the network effects on social platforms are, in fact, two-sided. Participants generally follow the 100-10-1 rule, with 1% creating content, 10% engaging with it, and 100% consuming it. Morgan Brown wrote a great piece on community metrics that draws a deeper analogy to marketplaces, referring to participants as “supply” and lurkers as “demand”.
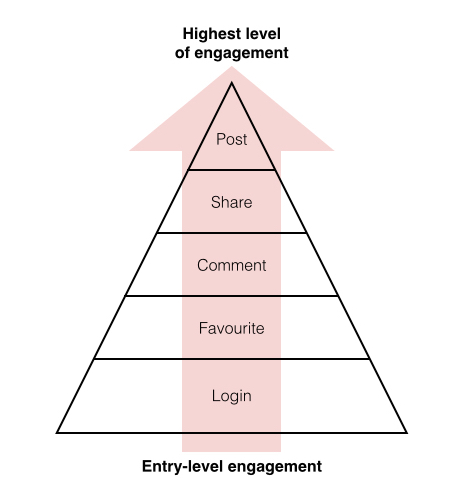
A sample engagement pyramid for social platforms
Knowing that “user-generated content is king” for social platforms, the most active users (creators) are therefore those who post status updates, photos, or links that are drive others to come to the platform time and time again. These creators are inspired when they are recognized for their contributions via shares, comments, favourites, etc., for their posts.
Given this positive feedback loop, it becomes clear that the goal of a social network is to encourage the logged-in user to be a contributor. Also, we note that the defensibility of social platforms increases as users participate in the same way – when they create and consume – because, after all, content is what ultimately drives engagement.
Build your engagement dashboard
Now that we have defined engagement, the next step is to understand how “healthy” that engagement is. From the list above, you can build a content engagement dashboard similar to what we did for the high-level metrics.
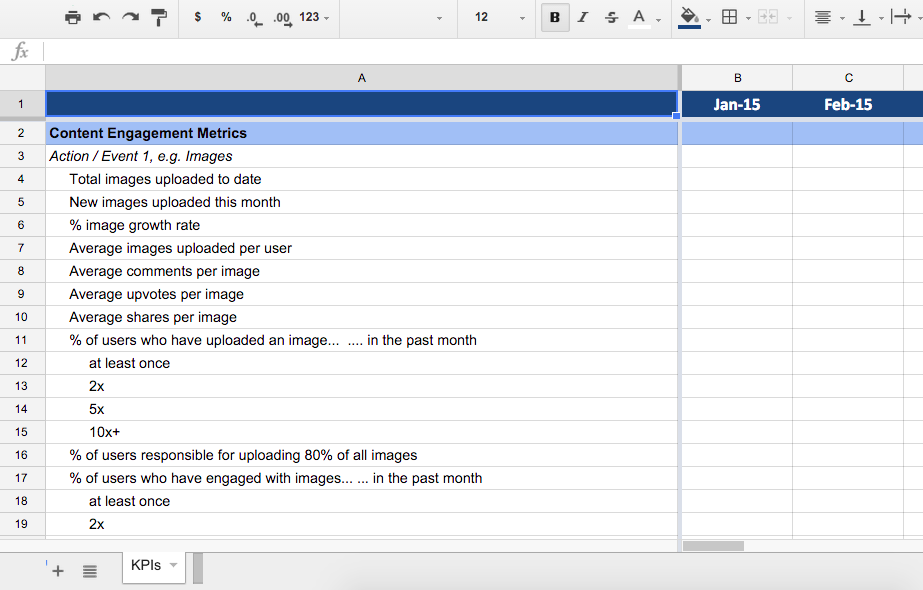
Our KPI dashboard for Social Platforms: access the updated Google spreadsheet with content engagement metrics here
For instance, on a monthly basis, you can tally all the “positive actions”. Let’s use images as our example. In this case:
- Total images uploaded to date
- New images uploaded this month
- % image growth (WoW, MoM, etc.)
- Average images uploaded per user (take the mean and median)
- Average comments per image
- Average upvotes per image
- Average shares per image
However, don’t stop there. We recommend understanding the distribution of these actions (i.e. plot a histogram). You can calculate useful metrics like:
- % of users who have uploaded an image at least once, 2x, 5x, 10x in the past week, month, or year
- % of users responsible for uploading 80% of all images
- % of users who have engaged with images at least once, 2x, 5x, 10x in the past week, month, or year
- and so on…
We also recommend that you track your user journey while using the platform in order to understand if there are some actions that tend to lead to others and where there can be improvements made to push people to be content creators. I wrote a post on correlation vs. conditional probability that outlines an easy way to understand the relationship between two actions or events.
If you haven’t already done so, you can download the KPI template here. If you have any questions or comments on these metrics, share your thoughts below. And next week, we’ll discuss the last piece of the puzzle – measuring engagement by relationships.