A few months ago, I wrote about the questions that we typically ask when evaluating a marketplace opportunity.
Now, inspired by our friend Christoph Janz at Point Nine Capital who created a KPI dashboard for early-stage SaaS, we have put together a KPI template for marketplaces.
We recognize that every marketplace is different, but each one is also similar at its core: each marketplace has a seller (supply) and buyer (demand) side, and acts as an intermediary to bring them together.
We hope that our version of a Marketplace KPI dashboard helps founders manage their business and pre-empt those due diligence questions in a fundraise. Below are some screenshots of the template which you can also access via the Google doc here (make a copy of it and then you can edit away).
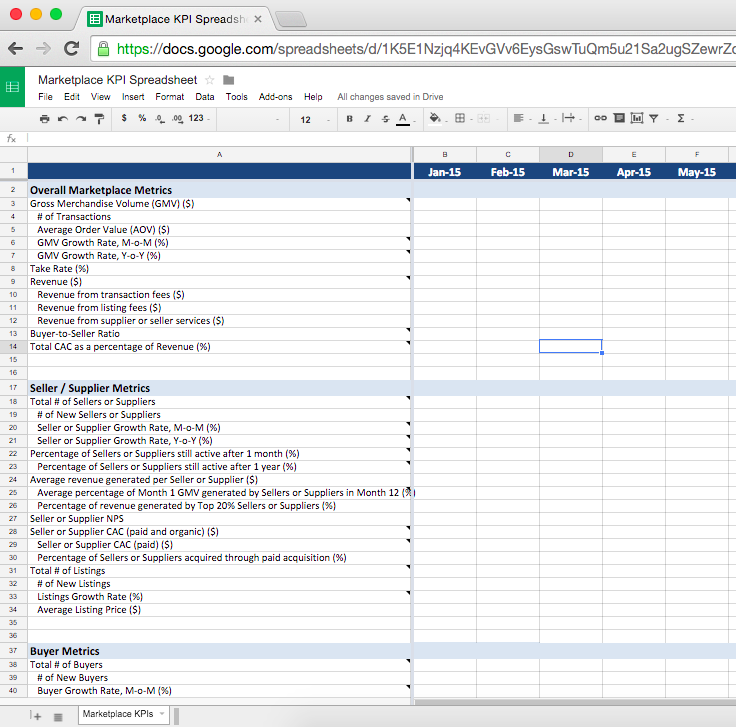
Screen shot of Marketplace KPI Google Spreadsheet
There are plenty of notes within the dashboard itself but here’s a high level overview. The dashboard is separated into three dimensions to measure the efficacy of your business: 1) overall marketplace metrics; 2) seller/supplier metrics; and 3) buyer metrics.
Overall Marketplace Metrics
Gross merchandize volume (GMV) is the total sales dollar value for goods sold or services purchased through the marketplace over a certain time. Given that GMV is one of the most important marketplace KPIs, founders should track its growth rate on a monthly and yearly basis, and understand its makeup by customer acquisition channel. With GMV and the total number of transactions, we can compute the average order value (AOV) since:
GMV = # of Transactions * AOV
Revenue is the income that the company receives from facilitating connections in the marketplace. It comes in the form of transaction fees, listing fees, and/or the offering of premium seller/supplier services. With revenue and GMV, we can calculate take rate via:
Revenue = GMV * Take Rate
In addition to take rate, we can evaluate business efficacy by calculating the total customer acquisition cost (CAC) of buyers and sellers/suppliers as a percentage of revenue.
Seller/Supplier Metrics
Start with general seller/supplier and growth KPIs, for example:
- Number of sellers/suppliers
- Sellers/suppliers growth rate
- Number of listings (n.b. in a services marketplace, this is not applicable so perhaps consider the number of active suppliers at a specific time instead).
- Listings growth rate
- Average listing price
- CAC
Engagement KPIs are most important to the seller/supplier side so make sure you track these at the very least – examples:
- Cohort analysis: percentage of sellers/suppliers still active 1 month and/or 1 year after signing up
- GMV retention: average percentage of Month 1 GMV generated by sellers/suppliers in Month 12
- Concentration: percentage of revenue generated by the top 20% sellers/suppliers
- Net promoter score (NPS)
Buyer Metrics
Similar to seller/supplier metrics, we can categorize these into general and engagement.
General KPIs – examples:
- Number of buyers
- Buyer growth rate
- Average dollar amount purchased per buyer
- Average number of orders per buyer
- Average order growth per buyer
- CAC
Engagement KPIs on the buyer side – examples:
- Repeat buyer contribution: percentage of buyers who have purchased more than once; and percentage of GMV generated from buyers in previous months
- GMV retention: average percentage of Month 1 GMV generated by buyers in Month 12
- Concentration: percentage of revenue generated by top 20% buyers
- Cross pollination (if applicable): percentage of buyers whose second purchase is in a different category
- NPS
Closing Notes
Any thoughts or questions on the dashboard? Please comment below, as we’re sure there are many others that will benefit from the discussion. We’d also love any feedback on other important KPIs to add, or ones to remove. We’re looking forward to iterating!