Announcing our second eBook: Understanding Social Platforms
e-Books
If you have been following our blog or firm, you know how much we love network effects. Our investment thesis is centered around network effects, and our portfolio is full of network effects startups ranging from marketplaces to social platforms, SaaS and applications of AI and machine learning.
It has been a little over a year since we published our first handbook, A Guide to Marketplaces. And now, we’re pleased to announce that we have just produced our second eBook, “Understanding Social Platforms.”
Why social? As individuals, we use social platforms on a daily basis. As investors, we love the underlying business models, including the daily use case, virality, and network effects. Humans have an innate need to interact with others. As a result, there will always be room for companies to dream up new ways to help us connect, share, learn, and participate.
Version One, as well as Boris as an angel, have invested in social platforms like Abstract, Edmodo, Figure 1, Shift Messenger, Wattpad, among others.
Over the past year, as we have been refining our investment thesis, we realized that not much has been written about social platform businesses. This is most likely because social platforms like Twitter, WhatsApp, and Figure 1 are quite diverse: it’s hard to draw conclusions that apply across them all.
To that end, we are sharing the insights we have gained from investing in, and watching, social platform businesses. In this book, we walk through the dynamics of each platform type: messaging, private networks, public networks, enterprise networks, and communities. There are chapters on metrics, exits, valuations, as well as our outlook for future opportunities in social.
Download the PDF or ePub version of the handbook and refer to it as you need it.
Lastly, we’d love to hear if you find the content useful. What should we expand on? Did we leave anything out? Please leave a comment below or reach out to us directly.
Feb 2017 update: this eBook is now summarized in slide deck form for for a quick refresher.
Table of Contents
INTRODUCTION
WHY ARE SOCIAL PLATFORMS SO SPECIAL?
From the early days of the Internet, whether it was the first email at ARPA or Usenet bulletin boards, the Web has enabled people to communicate and collaborate in new ways. Social platforms further this evolution, tapping into our inherent human desire to
Connect. In many ways, social platforms accelerate natural offline behaviors: instead of 100 connections, we now have 1,000 or 10,000.
As individuals, we use social platforms on a daily basis. As investors, we love the underlying business models and opportunities. Here’s why:
- Daily use case: Most likely, you already checked Facebook or Twitter at least once today. Social networking is the daily use case on the Internet. The average user logs 1 72 hours per day on social platforms — that’s more than a quarter of all time spent online. In 2015, Facebook’s daily active users accounted for 65 percent of its monthly active users.
- Social content discovery: Social networks changed how we find content and what we read. These platforms broke down the traditional aggregators (publishers) and created new sharing/distribution systems. As a result, we now read different things from different kinds of publishers. This has had a democratizing effect on content creation, as well as a fragmenting effect on readers, as people tend to seek out the content and groups that support their existing viewpoints.Social content discovery is so powerful that content platforms are doubling down on interactions between members. Just look how Medium shifted its focus from content creation to social interactions, encouraging readers to share content with their friends and favorite posts.
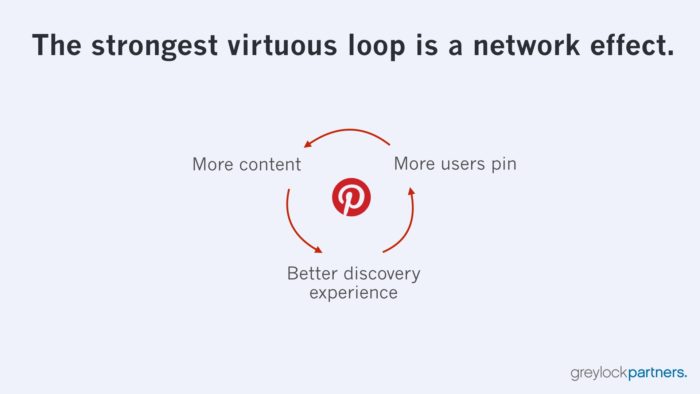
- Strong virality and network effects: Social platforms can exhibit both virality and network effects, two of the holy grails for Internet startups. Social networks, like other collaboration and content-sharing startups, enjoy inherent virality; these products are naturally intended to be shared. As more people use a social network, sharing increases, and hopefully adoption increases as well. Up to a certain point, a social platform grows faster as more people use it.In addition, a social platform’s value increases as more users join (network effects). More users mean more value, further encouraging others to join, and making the platform even more valuable. In turn, this attracts other users, continuing the cycle and leading to a winner-takes-all (or winner-takes-almost-all) dynamic. Network effects create a powerful moat, posing a serious challenge for any upstarts. If all of your friends are on Facebook or WhatsApp, you’ll be relatively lonely if you join a brand new platform. That’s a tough reality for many social startups to overcome.
There’s no doubt that social platforms have had an enormous impact on both the Web and mobile over the past decade. There are great lessons to be learned from some of the major players and their success stories.
So, why are we writing an ebook on social platforms? At Version One we have a keen interest in all network effects businesses — including marketplaces and social platforms. Version One, as well as Boris as an angel, have invested in social platforms like Abstract, Edmodo, Figure 1, Shift Messenger, Wattpad, among others.
Over the past year, as we have been refining our investment thesis, we realized that not much has been written about social platform businesses. This is most likely because social platforms like Twitter, WhatsApp, and Figure 1 are unique: it’s hard to draw conclusions that apply across them all.
Here is our overview of social platforms and the insights we have gained through investing in, and watching, social platform businesses. We’ll walk through our classification of each platform type, the dynamics that make them work, metrics, exits, and valuations. We’ll summarize our outlook for future opportunities in social, from the enterprise and niche verticals, to Messaging as a Platform and conversational commerce. We hope you’ll find it useful in your own journey.
Happy reading!
— Boris and Angela
1 – OVERVIEW OF SOCIAL PLATFORMS
Before diving into a detailed analysis of social platforms, we should first establish a working definition. At Version One, we consider something to be a social platform if the interactions on the site are driven or defined by an underlying relationship between the participants.
We identify five distinct types of social platforms:
- Messaging (e.g. WeChat)
- Private social networks (e.g. Facebook)
- Public social networks (e.g. Twitter)
- Enterprise social platforms (e.g. Slack)
- Communities (e.g. Reddit)
We’ll discuss each platform type in the chapters to come.
CATEGORIZING SOCIAL PLATFORMS
As you can imagine, there’s a lot of diversity among the five social platform types listed above. We typically categorize social platforms based on the following criteria:
- Nature of content: Is content private or public?
- Broadcast model: Is content shared one-to-one or one-to-many?
- Connections: Are relationships asymmetric (i.e. Follow/Subscribe) where a person listens to another without the intention of building a relationship? Or do connections require opt-in from both sides (i.e. Add Friend, Connect)?
- Nature of relationships: Is the underlying relationship between participants a personal one, a connection to a shared interest, or a connection to the whole world?
In addition, social platforms differ in terms of being:
- Permanent vs. ephemeral: It’s become second nature for us to post, share, and hashtag on social networks, building up a public persona and creating a digital paper trail in the process. As so much of our lives is played out in the public eye, the pendulum is beginning to swing from widespread sharing to ephemeral apps where things disappear after a brief time. Snapchat is widely popular among teens, who don’t want a digital trail following them for the rest of their lives.
- Real name vs. username: One of the biggest factors to shape the dynamics on a social network is whether users need to identify themselves by their real name (i.e. Facebook or any other site relying on Facebook’s credentials) or if they can remain anonymous behind a username.
We’ll discuss many of these dynamics later in this book. For now, the key takeaway is to appreciate how diverse social platforms are when it comes to the nature of relationships and interactions.
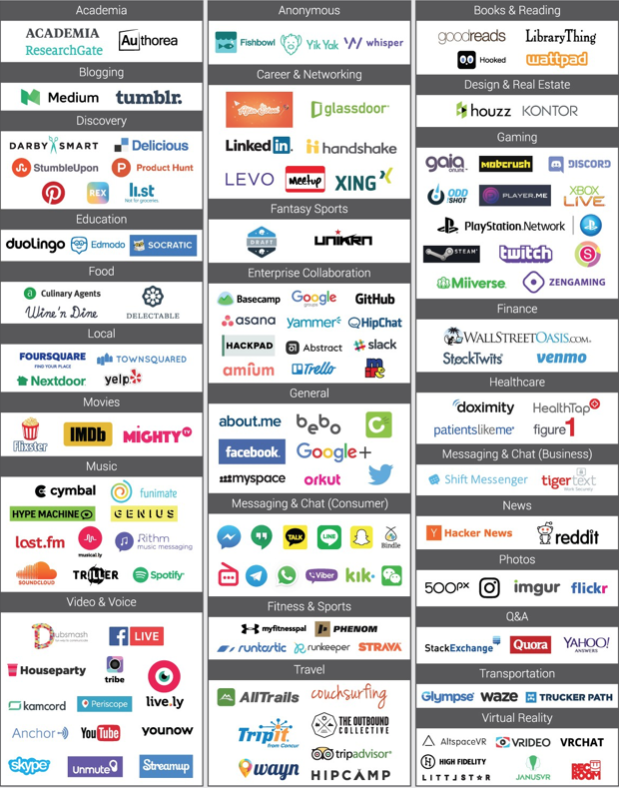
Market Map of Social Platforms
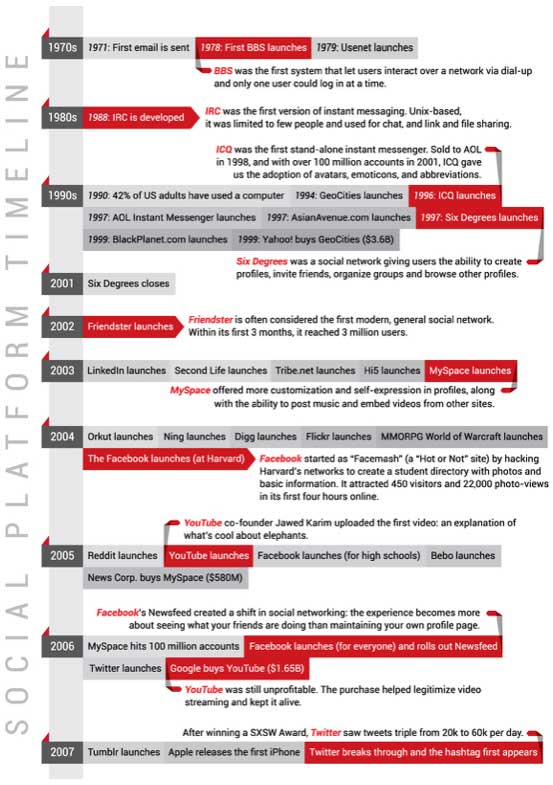
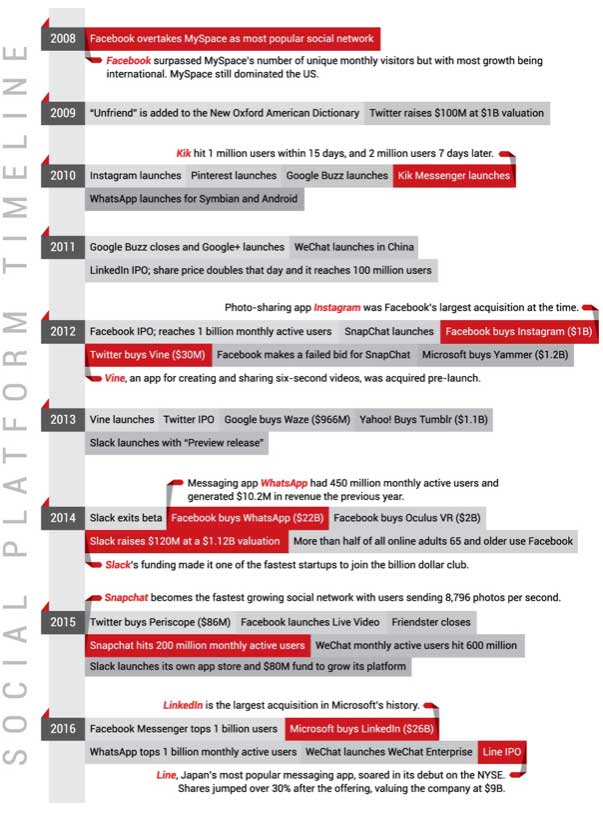
Social Platform Timeline
SOCIAL PLATFORM SUCCESS FACTORS
There’s still a lot of opportunity to build new social platforms. However, not every new network will take off, even those that find the right niche. When we’re evaluating social platform companies, there are four criteria we consider:
1. The depth of the underlying relationships
Social interactions are the core of every social network and the depth of the underlying relationships determines how sticky an app will be.
Generally speaking, network effects occur when a product or a service becomes more valuable to its users as more people use it. The key factor is the quantity of users: more is better. However, for social platforms, the value of a network isn’t measured by size alone, but also by the types of users themselves. More specifically, we need to look at the underlying relationship between new users and existing users, as well as the influence of the new user.
When a close friend joins a messaging platform like WhatsApp or a private social network like Facebook, you gain more value than when that same close friend joins a community like Reddit. On a public social network like Twitter, an active user with lots of influence (e.g. a celebrity) will be of more interest and drive more value for the entire user base than a lurker.
Social platforms shouldn’t think about increasing their user base in terms of raw numbers alone, but must also weigh the value that particular users bring to the platform. How much do users care about the people they are interacting with? Is the communication reciprocal (bidirectional)? Are there existing online/offline relationships, as well as newly made ones? Are users inviting friends from other networks? It’s important to know if the platform’s value is based on bringing offline relationships online or extending online relationships to a new network (like we see with Reddit/Twitter).
2. Daily use case
Given the fact that engagement is the most important metric for social platforms, a daily use case is important, if not imperative. If we look at some of the leading social startups, all have a daily use case. Snapchat: people communicate with friends every day Instagram: people take photos every day Pinterest: people surf the web and want to bookmark things every day.
Of course, there are big, successful businesses without a daily use case. LinkedIn is a prime example. To most, LinkedIn is the place to go when looking for a job or looking to hire. The platform hasn’t yet found a way to become part of everyone’s daily ritual like Facebook and Twitter, but it’s working to morph into a content platform to get its users to come back more regularly.
3. Native monetization opportunity
No matter how high engagement levels may be, a social platform business won’t succeed without an effective monetization strategy. If we look at top platforms like Facebook, Instagram, and Twitter, native ads, which match the visual design and user experience of the site, are growing in popularity. Publishing giants like The Wall Street Journal, Time, Forbes, and USA Today have all introduced native ads.
The push toward native ads is driven by two things. First, people don’t want to be disturbed in their social activity, so ads that look and function like natural content help protect the user experience. Second, because of the opportunity to personalize or target specific users instead of a general broadcast, native ads are proving to be more successful at conversion and thus drive higher ad rates and monetization. Research from IPG Media and Sharethrough showed that consumers looked at native ads 53% more frequently than standard display ads.
4. Personalization of content
As the pace of content creation accelerates, people are drowning in information. In most cases, a chronological newsfeed does not provide users with the most engaging and relevant content, so a platform’s objective must be to surface the most relevant and important information.
In our opinion, Facebook currently offers the best newsfeed experience. Since it retired EdgeRank years ago, Facebook uses machine learning to track users’ actions and serve the posts and content that they’re most likely to engage with. For example, people who click on photos see more photos in their newsfeed. Facebook’s personalization of its newsfeed is its major differentiator against Twitter’s mostly unfiltered timeline.
In the following chapters, we’ll discuss the different dynamics at play in each of the five social platform categories: messaging, private social networks, public social networks, enterprise social networks, and communities. We’ll walk through the history of each type, lessons learned from the category leader(s), as well as ways to evaluate social platforms and trends going forward.
THE KEY METRICS FOR ANY SOCIAL PLATFORM
Every social platform is defined by engagement and monetization levels. We’ll take a deeper dive into metrics in Chapter 7, but as an introduction, the three key metrics are:
- DAU: Daily Active User
- MAU: Monthly Active Users
- ARPU: Average Revenue Per User
At Version One, we consider the DAU/MAU ratio to be the most important. What percentage of monthly active users visit on a daily basis? When a platform is highly engaging, this number will be above 30-40%. For example, Facebook’s daily active users account for an incredible 65% of its monthly active users (as of December 2015).
2 – MESSAGING
Messaging platforms are becoming the primary way we communicate. That’s because the ubiquity of mobile makes messaging so easy. Michael Wolf’s deck on the Future of Tech and Media shows that messaging will soon blow past social networking as the dominant online activity. The opportunities around messaging platforms are very interesting — particularly in terms of how to leverage messaging to help solve problems at work and in daily life.
MESSAGING APPS BY THE NUMBERS
Why are messaging apps such a prime focus for Facebook, Google, Apple, startups, and investors? The answer is simple: they’ve got a massive user base and are where people spend their time. For example:
- WhatsApp: more than 1 billion monthly active users in February 2016, up from over 700 million in January 2015
- Facebook Messenger: 900 million monthly active users (April 2016), up from 500 million MAUs in November 2014, 600 million in March 2015, and 700 million in June
- WeChat: 760 million monthly active users (June 2016)
Kakao Talk: 160 million users (September 2015)According to the Activate Tech and Media Outlook 2016, 2 5 billion people are using messaging apps worldwide today. And, the numbers are still growing: more than 1 billion new users will start using messaging apps by 2018.Much of the projected growth in messaging will come from the Middle East and Africa, where smartphone penetration today hovers below 25%. By comparison, smartphone adoption ranges from 70-81% elsewhere. As smartphone adoption increases in emerging markets, these users will most likely onboard via cheap and convenient messaging platforms.
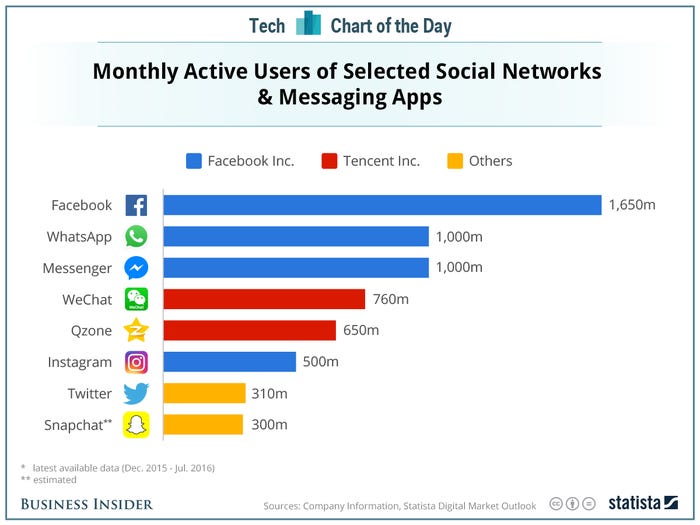
Source Business Insider
TODAY’S MESSAGING LANDSCAPE
If we look at the current messaging landscape, we see three different categories:
1. Plain SMS/text messaging
These are basic messaging services with stickers, group chat, and other extras added on top. The big global winner outside the US and Southeast Asia has been WhatsApp. Its global success has been due to two things. First, it provides an alternative to SMS, particularly in countries where carrier-provided SMS is expensive. Second, WhatsApp was cross-platform from the start, meaning you weren’t locked into communicating with just your BlackBerry or iPhone friends.
2. New behaviors
Snapchat created a new messaging behavior and has been so successful by tapping into the worry that everything shared on the web is part of your permanent, and potentially public, digital record. Benedict Evans writes:
“The challenge for these [services] is to find a behavior that’s different and compelling enough to create that growth, but not weird or specific enough to be a gimmick or fad or flame out.”
3. Platform approaches
These are messaging apps that extend the experience beyond person-to-person messaging into a development environment. WeChat has been able to succeed at this in China, but the jury is still out as to whether this same approach will work in North America, which has big vertical category killers like Google, Facebook, and Amazon.
NO WINNER TAKES ALL YET
Even though WhatsApp is enjoying its status as the market leader among messaging apps, we’ve yet to see a category killer emerge, like Facebook has with private social networking. Why is the messaging landscape still so fragmented? There are multiple dynamics at play but the two key factors are that messaging apps have low network effects and low switching costs.
1. Messaging has low network effects
Generally speaking, messaging apps have very high virality, but lower network effects. If someone joins a messaging app, there’s very little benefit to you (unless you already know them personally). This means that the size of the messaging service’s user base (even if it’s hundreds of millions of users) doesn’t create the moat that it does on a social network like Facebook.
2. Messaging has low switching costs
When thinking about switching costs, one of the first things to realize is that messaging apps are tied to the smartphone, which is a social platform itself (for more on this, see Benedict Evans’ post “Messaging and Mobile Platforms”).
Mobile apps can access your phone’s address book (instant social graph), as well as your camera and photos (for instant sharing). In addition, on the phone, every app is just two taps away on the home screen, which makes switching between services easier. This also drives the trend for focused, single-purpose apps instead of mega apps that do everything.
If your phone is inherently built for social applications, then it’s much easier to join a new social service from a different company on your phone. It’s also much easier to use multiple apps at one time. As Evans said, “People can swap apps in and out for different behaviours or content types or social groups, on top of that underlying platform, and they do it all the time.”
This is why we use multiple apps like Twitter DM, GroupMe, HipChat, Skype, Instagram, Facebook Messenger, and iMessage.
There are a few other factors driving messaging’s low switching costs:
- Most instant messaging usage is driven by teens, who can be less loyal than other audiences and quicker to try new services. We see younger consumers gravitating toward fresh services like Snapchat and Kik.
- There’s a smaller social graph associated with messaging than Facebook. For example, you may text with 10-20 people, while the average person has 300-400 Facebook friends This means that there’s a far lower cost to switch your messaging app provider, because you’re leaving a smaller group behind.
- Messaging lives purely in the present. Your history on a messaging app is far less important than on a social networking site like Facebook, Instagram, and possibly Twitter. For example, Facebook has become a virtual repository of all the important, and not-so-important, things that happened in your life. For many, the platform stores photos of vacations, parties, graduations, weddings, babies, etc. It hosts years of conversations and announcements.
While the text you sent five minutes ago may not matter any more, you most likely don’t want to abandon the content you posted on Facebook two years ago. In other words, your history locks you into a site like Facebook, but there’s no such effect in the temporary world of instant messaging.
WHAT IT TAKES TO WIN
How can a messaging app succeed considering that the act of messaging itself is such a utilitarian feature? The apps that grew fastest initially solved a pain point for a key user group. WhatsApp grew first in Europe where texting plans were extremely expensive. Snapchat grew fastest among teenagers where the fear of a “permanent texting record” is the strongest.
As we discussed, it can be difficult for a messaging app to build a moat around itself given the low switching costs. But there are a few strategies a messaging app can take to encourage loyalty among users. For example, apps can provide deeper context for content, so real-time messages aren’t immediately irrelevant. Another strategy is to differentiate by providing more than just text/image messaging. Kik Messenger offers Kik Cards, lightweight apps like games that can be sent, received, and opened within conversations.
MESSAGING BUSINESS MODELS
One of the key issues with messaging apps is that lots of traffic and users don’t necessarily translate to lots of revenue. Juniper predicts, as reported by Forbes, that revenue from texting on chat apps like WhatsApp and LINE will make up just 1% of all the revenue generated by SMS and chat in 2019. The vast majority of revenue will still come from traditional SMS over carrier networks.
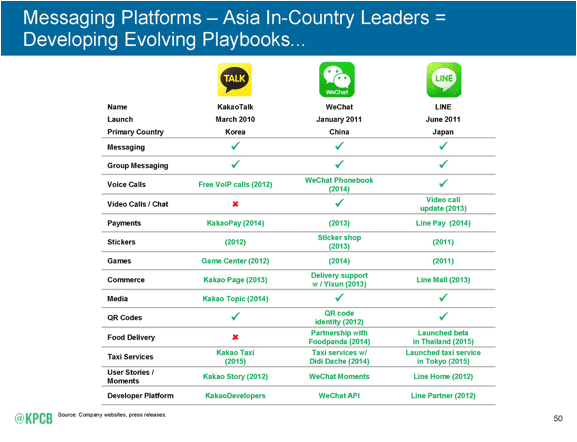
Asia has the most advanced messaging market in the world, and offers a good snapshot for how messaging companies are dabbling with extra services to find revenue. Mary Meeker’s 2015 Internet trend report shows the evolving revenue playbooks for WeChat, LINE, and KakaoTalk, as shown in the following graphic:
Subscriptions
In the past, when we talked about the subscription fee model and messaging, we always used WhatsApp as the prime example. However, WhatsApp abandoned its subscription fee in January 2016, explaining that “[as WhatsApp’s] grown, [it has] found that this approach [subscription fee] hasn’t worked well. Many WhatsApp users don’t have a debit or credit card number and they worried they’d lose access to their friends and family after their first year.” This is an important lesson, particularly for messaging apps operating in emerging markets. Instead, WhatsApp will now test ways for businesses to communicate with their customers.
Ads
In late 2015, Snapchat began introducing ads into its ephemeral messaging service. McDonald’s, Samsung, Macy’s, and EA have since paid for quick videos and photos (snaps) that show up in users’ Recent Updates feeds. According to Adweek, Snapchat is asking brands for $750,000/day for these ads.
There are a couple of challenges associated with in-app advertising. While a native ad in a newsfeed is just another content unit, an “ad message” is an interruption that won’t always be appreciated. In other words, in-app advertising in messaging is “push” versus newsfeed’s “pull.” In addition, since messaging content is encrypted, the app platform can’t read a user’s content. This means the platform can’t learn about the interests of its users in order to serve up more personalized and relevant ads.
This is still a very young market, and much work has to be done on both the ad experience and backend. For example, Snapchat’s ad platform currently lacks the full reporting capability that brands are used to seeing in return for their advertising dollars.
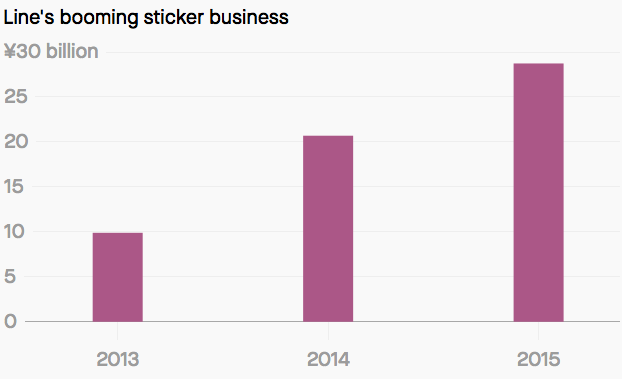
In-app purchases of premium stickers/emoticons/features
In-app purchases have been very successful in mobile video games, where users pay for virtual gold, lives, or hints with real money. This same model is also working for several messaging companies, where stickers (the ability to use pre-set images in texts) have evolved into an important visual language capable of conveying nuance and emotion.
As of March 2016, Line had 259,499 sticker sets available and Line users send an average of 389 million stickers per day. That means that 9% of all messages on the platform include stickers. And in many cases, a sticker is a standalone message. Stickers have generated $268 million (¥28 7 billion) in revenue in 2015, representing about 25% of the company’s revenue.
Connie Chan provides a great overview on the significance of stickers on the a16z blog:
“Sometimes stickers can convey what words cannot! This form of visual communication has become so popular in Asia — especially in China’s WeChat and Japan’s LINE [Line] — that it is not uncommon to see a deep thread of multiple messages without a single word. They’re not just for those crazy young kids. More notably, stickers are commonly used in professional, not just personal, chats as well. Not so frivolous after all. In fact, stickers are so core to the success of Line, that its CEO actually credited them as the “turning point” for that app. He shared that it took Line Messenger almost four months to find its first two million users … but after stickers were launched, it took only two days to find the next million. The company now makes over $270M a year just from selling stickers.”
Distribution platform for m-commerce
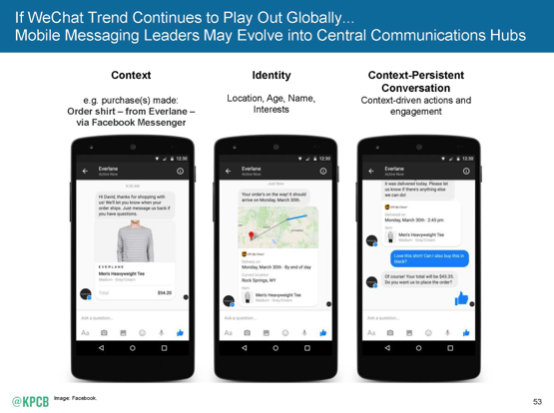
Merchants have been selling goods via WeChat for several years: back in 2013, Chinese smartphone maker Xiaomi sold out of its Mi-3 phone in less than 10 minutes using only WeChat. The entire process, from reserving the device to purchasing it, took place within the messaging app.
WeChat has become The Everything App for its users. In China, people use it to buy things, send money to friends, book train tickets, order dinner, control their smart phone, schedule a doctor’s appointment and much more. If the WeChat trend continues to play out globally, mobile messaging apps may evolve into our central communications hub (as shown in the next graphic).
In April 2016, Facebook released its messenger platform API, allowing businesses to deliver automated customer support, e-commerce and other experiences through chatbots. Kik, Line, and Telegram have their own bot platforms as well. Some early use cases for Facebook Messenger chatbots include The Wall Street Journal (for live stock quotes and article headlines), Uber (order an Uber), 1-800-Flowers (order flowers), HP (print photos through FB Messenger), Healthtap (free advice for health questions), Trim* (AI-driven financial advisor).
As messaging platforms are opening up, we can expect m-commerce and more. There’s no real monetization at scale yet, but it’s only a matter of time when Messenger and others charge for conversational commerce. This also presents a great opportunity for commerce start-ups to open up a new distribution channel.
*Portfolio company
3 – PRIVATE SOCIAL NETWORKING PLATFORMS
When we’re talking about private social networks, we’re referring to social platforms that have standardized two-way friending, where the connection must be accepted by both parties.
It may be hard to believe given the dominance of Facebook and LinkedIn today, but this was once a very fragmented vertical. For example:
- Friendster (launched in 2002) was once the hottest thing in social networking, but was pretty much dead in the U S by 2006. It was acquired in 2009; at that time it had 115 million members, with the vast majority in Asia.
- MySpace (launched in 2003) hit 100 million accounts to become the most popular networking site in the world.
- Bebo (launched in 2005) had over 40 million users, and over 1 billion page views/ week in 2008 (30-40% of its registered users were in the UK).
- Orkut (launched in 2004) was Google’s first foray in social media and had the most traction in Brazil and India — it was one of the most visited websites in those two countries in 2008. Google closed the site in 2014.
However, by 2009 Facebook became the most popular social networking site, just five years after it launched its Harvard-only version (thefacebook com). Since then, it has emerged as the category leader. Early competitors like MySpace and Bebo are inconsequential. The same is true for international competitors like StudiVZ in Germany.
HOW DID FACEBOOK WIN?
Having a daily use case has been the key to Facebook’s success. With the introduction of Newsfeed, Facebook shifted the goal of social networking from maintaining one’s own profile (like with MySpace) to following what the people you care about are doing. For many, Facebook is a morning ritual, similar to reading the newspaper, that is repeated throughout the day as fresh content continuously streams in.
Facebook’s daily use case is driven by two key factors:
- The depth of the relationships of the members on the platform. You won’t log in every day if you don’t care about the people on the platform. The two-way friend request ensures users most likely have an existing relationship and are interested in the connection.
- Relevance of content. This is driven by the previous point. In short, we care what our friends, family, and other connections are doing, reading, and sharing.
It should be no surprise that Facebook has impressive daily metrics: its DAU/MAU ratio (a measure of stickiness) has held firm at 65%. Users aren’t visiting less even as the site ages.
While Facebook is the undisputed category leader among private social networks, LinkedIn can be considered the leader in professional social networking (although its leadership position is much more tenuous than Facebook’s).
One of LinkedIn’s strongest points is that it created brand new social graphs for people. By connecting you with co-workers, former co-workers, and other business contacts, LinkedIn provides a business-centric network that’s different than your social graph on Facebook. Why is this important? If you dropped your LinkedIn profile, you’d lose that social graph and it wouldn’t be replaced on Facebook or another site.
However, LinkedIn’s story shows us that the creation of a new social graph isn’t enough for success. The company is working to morph into a content platform to get its users to come back more regularly. In other words, the company needs to find its daily use case.
VIRALITY AND NETWORK EFFECTS WITH PRIVATE NETWORKS
A successful private social network exhibits both virality and network effects. Facebook grew very rapidly because it is inherently viral; the company spent very little money on marketing and sales, as their users did most of the acquisition work for them. It also flourished as a network of networks. Every single user has his or her own personal network, as well as being part of the overall network on the platform.
Facebook originated in a college setting, where people more or less have homogenous social groupings (personal friends that you go to school with). But as Facebook expanded beyond college, so did everyone’s social graphs. Members started to build out their social network group by group: high school friends, elementary school friends, work friends, family members, sports teammates, and eventually Facebook started offering the option of one-way friending (following) influencers. The fact that members can overlap across groups helps grow the network faster.
LinkedIn can also be considered a network of networks, although the relationships are less segmented and complex. Professional connections typically fall into just a few buckets: former colleagues, current colleagues, and alumni connections.
BUSINESS MODELS
If a social platform does well and reaches scale, can it monetize the hundreds of thousands, or millions, of people using the product? That’s the core question for any founder. Here are a handful of approaches for private social networks to generate revenue:
Advertising
Advertising is typically the go-to monetization model for social startups because of the ability to segment individuals by interests, age, geography, and buying habits. This allows advertisers to target the audiences who are mostly likely to purchase their products or click on their content. Ads on social not only drive product purchases, but are used to promote events, content, causes, and more.
As expected, Facebook is the largest recipient of social media ad spending; eMarketer estimates that Facebook will take in more than two-thirds of all social media ad revenue in 2016. Facebook’s net ad revenue is projected to hit $22 37 billion in 2016, up from $17 08 billion in 2015. Over half of that sum will come from outside the U.S.
Distribution platform
Facebook is a powerful distribution platform. According to Parse.ly, and as reported in TechCrunch, Facebook delivered 41.4% of all referral traffic to publishers in Jan 2016, beating out Google and crushing every other traffic source.
However, Facebook no longer monetizes its distribution platform beyond advertising. The company has changed its newsfeed policies over time to find the right balance between organic and paid traffic. For example, social games were mostly driven by organic traffic in the beginning until Facebook closed these viral loops and game developers had to buy ads to get the same exposure.
In June 2016, Facebook changed its feed ranking again, putting higher priority on posts from friends and family than posts from Pages like news outlets. This should lead to a decline in reach and referral traffic for some news outlets, particularly if they rely on clicks directly to their own posts, rather than shares from users. As TechCrunch’s Josh Constantine summarized:
“The subtext here is that Facebook puts the benefit of its users above publishers, developers, advertisers, and even its own monetization. That’s because Facebook knows that if it doesn’t prioritize people, they won’t keep coming back. Without an audience, publishers can’t generate referral traffic, developers can’t gain app installs, ads don’t generate sales, and Facebook will wither.”
Subscription revenues for premium services
Keeping basic membership free is typically the best way to build up your network. As your network grows and members seek out more utility from your platform, you can offer fee- based premium content and subscriptions.
LinkedIn is the best example of this approach. The majority of LinkedIn users are free accounts, while LinkedIn sells premium subscriptions to individuals and talent solutions (hiring/recruiting) to businesses. More than two-thirds of LinkedIn’s revenue comes from its recruiting and hiring business (67%), compared to 18% from its ad business (Q1 2016).
The biggest challenge with the freemium model is determining what to give away for free so users are still attracted to your site, but may need and want to upgrade to a premium plan. If all of your users are fine with the free plan, you won’t have any revenue.
4 – PUBLIC SOCIAL NETWORKS
When we talk about public social networks, we are referring to social platforms that have an asymmetric follow model, where you can follow someone else without them following you back. In some cases, you can even view someone’s content on the platform without logging onto the service yourself.
Examples: Twitter, Instagram, Figure 1*, Vine, YouTube, Twitch, and Wattpad*
NETWORK EFFECTS AND THE 1% RULE
Social sites like Twitter and Wattpad have strong network effects. If you’re a user, you gain some benefit when someone else joins. However, as mentioned before, not every new user brings the same amount of value to the site.
In public social networks, as well as in online communities, participants generally follow the 1% rule:
- 1% of users create the content
- 9% engage with that content (e g share or retweet) 90% just consume the content (aka lurkers)
Back in 2011, Fred Wilson, an early investor in Twitter, discussed the company’s participation numbers following a Twitter press conference:
“Let’s remember one of the cardinal rules of social media. Out of 100 people, 1% will create the content, 10% will curate the content, and the other 90% will simply consume it. That plays out on this blog, that plays out in Twitter, and that plays out in most of the services we are invested in.
* Portfolio companies
Twitter has 400mm active users a month, 100mm of them are engaged enough to log in, but only 60mm tweet. For years people have made it out like this is a bad thing. It’s not a bad thing It is an amazing thing.”
Founders, investors, and the industry in general should set their expectations accordingly when it comes to participation numbers; it’s unrealistic to expect the majority of users to become content creators.
Successful public social network companies offer a great experience that makes it as easy and rewarding as possible when a user does try to get involved. It’s similar to any sales or transaction funnel where the ultimate goal is to lead participants through the funnel, and to encourage more of the 90% to become the 9%, and the 9% to become the 1%. The defensibility of a public social platform increases as more users join the ranks of the 1% or 9%, because, after all, content is what ultimately drives engagement.
And while the goal is to move participants through the engagement funnel, Fred Wilson has cautioned that companies should not ignore the value of the 90%. “Let people use the service the way they want and you’ll get more users. Logged out users are users just like logged in users. We should focus more on them, build services for them, and treat them like users, not second class citizens.”
PUBLIC SOCIAL NETWORKS AND THE INTEREST GRAPH
On private social networks like Facebook, people typically connect with people they already know. In this sense, the online connection is an extension of a connection that’s been forged offline. The same kind of connections are made in public social networks. However, the one- sided follow structure also lets you create online connections with people you’ve never met and most likely, will never meet. For example, you can follow your favorite celebrities on Twitter or strangers with a common interest on Pinterest. As a result, people organize around content (shared interests) on public social networks, as well as in online communities. We’ll discuss this trend more deeply in the Communities chapter.
PUBLIC SOCIAL NETWORKS AS A NEW FORM OF MEDIA
In many ways, social platforms are becoming media companies. Some are migrating from private networks to public ones in order to broadcast content to a broader audience and compete with traditional media companies. Snapchat streams Live Stories for special events like concerts and recurring channels from media partners like Major League Baseball Live Stories can get up to 20 million views in 24 hours.
Twitter inked a $10 million deal with the NFL to live stream 10 Thursday Night Football games. On opening night, more than 2 million people watched the game on Twitter, compared to 48 million who watched it on TV. While the number of viewers is low compared to cable, this was still considered a win for Twitter since it showed investors that some people will watch a live stream on their platform.
Twitter’s live stream and Snapchat’s Live Stories are early examples of how people will watch and interact with live events in the near future. We expect to see social platforms move deeper into premium-grade content streaming. What makes this trend very compelling is that social platforms know much more about their users than traditional media and broadcast companies ever have.
THE CHICKEN AND THE EGG PROBLEM
People join a public network for two things: content and community. But you won’t have either until you have a large and active user base. The key question is: how do you convince people to sign on and invest time when there’s not a lot happening on your site yet?
Fred Wilson wrote a great post on bootstrapping your network with a high value niche use case. “If you want to bootstrap a peer to peer network, you can’t start with the mainstream use case You need to start with the highest value use case, even if it’s a much smaller niche.”
He used Waze as an example. Everyone today knows of Waze as a traffic app. But Waze’s original use case was helping people avoid speeding tickets by sharing speed trap/radar detectors.
“Not everyone likes to drive 80 mph in a 65 mph zone. But the ones who do will take extra measures to avoid getting pulled over. They report the speed traps to everyone else in real time. Which is what the first users of Waze did.
That led to more people using Waze to avoid speed traps.And eventually that led to enough critical mass that the mainstream use case of a peer to peer traffic monitoring/avoidance application was possible.”
If you’re building a public (peer-to-peer) network, you’ll need to find the use case that has a high enough value to drive usage by some early adopters. If you can nail that experience, then, and only then, do you have the opportunity to go mainstream.
BUSINESS MODELS FOR PUBLIC NETWORKS
Native ads
Advertising is the core revenue source for public social networks. Niche networks like ResearchGate and GitHub are prime advertising platforms since they serve up a targeted audience (i.e. academics and developers, respectively) for advertisers.
Native ads work best in niche networks where advertisers know the targeted audience. Native ads can work on general networks like Twitter and Instagram, where advertisers can target some segment of the audience. However, given the 90-9-1 rule, we know less about the 90% on public networks than we know about users on sites like Facebook.
Pre-roll advertising
We are all familiar with pre-roll advertising on YouTube and other video platforms. If you tend to hit “Skip Ad” as soon as you can, you’re not alone: 94 percent of people skip pre-roll ads after that five-second mark. Yet, it’s not all bad news for brands and advertisers.
Research from Nielsen shows that just 3 seconds of pre-roll video can create up to 47% of the campaign’s value for ad recall and 32% of the value for brand awareness.
Like Pandora and other content distribution platforms, YouTube has rolled out YouTube Red where a $9.99 monthly fee lets you enjoy ad-free videos (among other benefits like access to original content and offline video and music).
The next evolution in pre-roll advertising is the integration of commerce with “click to shop” buttons appearing on YouTube’s pre-roll spots. Retailers Wayfair (home goods) and Sephora (cosmetics) are early adopters of this program.
Tipping/micro-donations
Micro-donations are an emerging revenue stream on social platforms. Most notably, this is happening on Twitch where viewers give small donations to broadcasters, sometimes in exchange for broadcasters to change their play. Micro-donations could become an important trend for those networks where there’s a strong connection between content creators and content consumers. However, before tipping can really take off in the mainstream, we need to reduce the friction around micropayments.
5 – ENTERPRISE SOCIAL NETWORKING
When we speak of enterprise social networking, we are talking about social software that’s used in enterprise contexts. These can be social intranets or other social platforms deployed by companies to connect employees, improve communication, and collaboration.
Examples: Slack, HipChat, Yammer, Jive, TigerText, GitHub, Facebook at Work
A BRIEF HISTORY
As social networks began to dominate personal communications, companies looked to implement their own private versions in the workplace. Enterprise social networks sprang up with aim of creating a corporate community and promoting collaboration among employees, particularly within larger companies where communication is typically siloed inside departments.
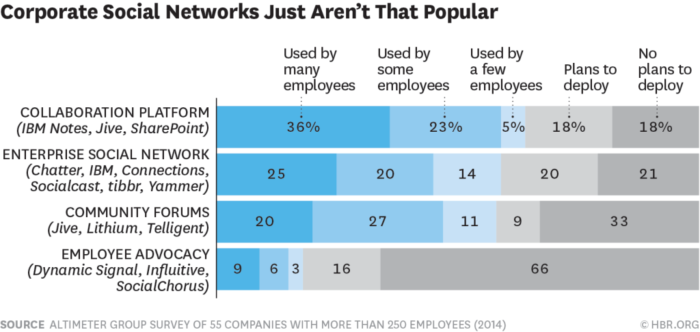
The foundation of enterprise social networking is relatively simple: a more connected company is a more productive and effective company. But we have yet to see the reality live up to expectations. Altimeter’s Charlene Li said, “The reality is that the landscape is littered with failed technology deployments.” Less than half of the enterprise collaboration tools installed are regularly used by employees.
However, as we’ll discuss, Slack is bucking this trend and represents a collaboration tool that employees actually use.
THE CONSUMERIZATION OF ENTERPRISE TECHNOLOGY
For nearly a decade, we’ve been talking about the consumerization of the enterprise. The ubiquity of smartphones and mobile-first consumer apps have changed our expectations for what software can be. The clean design and inviting experience of consumer products often stand in stark contrast to the complicated and clunky mess of enterprise software. In particular, mobile versions of enterprise applications that were originally designed for the desktop don’t deliver the fast and responsive experience that users now expect from their apps.
Lackluster experiences with existing enterprise products pushed employees to take matters into their own hands. They began using personal devices or applications at work, and these “consumer” tools turned out to be enjoyable to use and helpful for getting things done. Use then spread among co-workers until the tool became so entrenched in day-to-day workflow that IT had no choice but to purchase and deploy it company-wide.
Consumerization of the enterprise is driven by a groundswell of interest from the bottom up. This means that a product’s first customer is the end-user (aka employee). Social platforms that aren’t intuitive, responsive, and useful won’t be adopted.
However, for an enterprise product to reach real scale, it will ultimately need to be accepted and adopted by traditional gatekeepers in the enterprise (e g CIO, IT, operations). As such, the app will need to address typical corporate concerns like security, privacy, data ownership and portability, support, as well as APIs to plug into other enterprise software.
We’ve seen different enterprise social networks crop up for different verticals. Each vertical has a distinct workflow: a social network that works for one industry won’t necessarily work for another. For example, there’s TigerText for healthcare, Shift Messenger for hourly workers, and Slack for tech. By focusing on a particular vertical, the network can tailor its platform to the particular needs of those workers for a superior user experience.
NETWORK EFFECTS IN ENTERPRISE PLATFORMS
While network effects have a smaller impact on enterprise social networks than consumer platforms, they can be a factor for groups with a high degree of cross-organizational collaboration, as well as collaboration with external vendors and companies. If all other groups and business partners are using Solution A, you need a very compelling reason to use Solution B.
User familiarity typically contributes more to an enterprise platform’s staying power. When users are comfortable with a certain interface and workflow, it can be hard to unseat an incumbent solution. For this reason, it’s imperative for upstart companies to make their products as intuitive and easy to learn as possible.
THE RISE OF SLACK
Slack is a testament to just how viral a good enterprise tool can be. Twenty months after its February 2014 launch, Slack had more than 1.7 million users. Its user base grew 5% each week for 70 weeks running. And, it accomplished this growth without any salespeople. Ninety-seven percent of Slack’s new customers are referrals.
Slack is making aggressive moves to evolve from tool to platform. It launched an App Directory to help teams find useful apps that work with Slack. The Slack Ideabook helps developers build apps and features that Slack users are looking for. And along with its investors, Slack launched an $80M Slack-first fund to back developers that make Slack integrations part of their core product. This is all part of a strategy to build a vibrant platform: competitors may be able to copy Slack’s messaging features, but they can’t recreate its developer ecosystem and network effects.
Slack has been better than everybody else at using bottom-up distribution to become the leading enterprise social network, but will it become a network of networks like Facebook? Will entire organizations outside of the tech world use it to communicate? Will people who belong to different organizations (e g vendor and customer) converse through Slack?
Major players are trying to compete with Slack for the enterprise social space, including Facebook Workplace and Microsoft Teams. Microsoft is looking for a new social platform in the post-Yammer era and can leverage its newly acquired LinkedIn network. Yet at the time of writing, it’s unclear to us how much traction either platform will ultimately have.
BUSINESS MODELS FOR ENTERPRISE SOCIAL NETWORKS
Founders of social startups often face the core question of whether to focus on monetizing customers or driving usage.
For consumer apps, this question has been mostly answered: the best approach is offering a free service to help attract and retain users. As Fred Wilson put it: “When scale matters, when network effects matter, when your users are creating the content and the value, free is the business model of choice.”
But what about enterprise apps? While free rules the consumer world, is it a different story in the enterprise?
Offering an app/service for free can send the wrong message. Here, free can be equated with low quality. In addition, free isn’t necessarily sustainable with B2B. Acquiring business users may prove too costly, forcing startups to raise incredible amounts of money to finance aggressive sales and marketing efforts for a free app.
The two main monetization models for enterprise social platforms are:
Fee: per user, per month
This approach mirrors that of a traditional SaaS tool and is more suited for products that follow the traditional top-down sales approach.
Freemium (free for general use; fee for private groups, enhanced features, and integration to other services)
As used in the consumer app world, freemium price structures encourage widespread use. With little to no friction during the sign-up process, freemium tools can spread quickly among co-workers, colleagues, and friends. Then, after individuals adopt the tool for their team, the enterprise purchasing or IT department can formalize the adoption, paying license and other fees for added security, usability, and integration features.
The freemium model has been an effective choice for Slack (see below for details on its pricing structure). The company has a very high conversion rate, currently standing around 30%. It’s also worth noting that Slack has adopted a unique approach for enterprise software: it bills only for active users as opposed to registered users.
Some keys to success for the freemium model: make it as easy as possible for users to sign up and get started, then have a clear message for the corporation on how individuals are currently using the platform and the benefits of upgrading to the paid version.
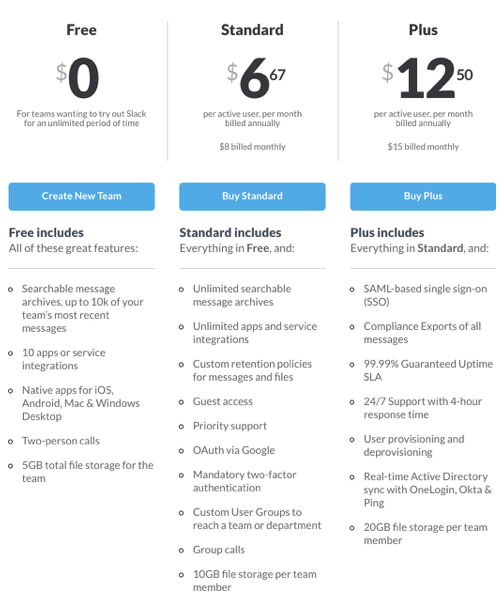
Slack for Teams pricing tiers, as of Sept. 2016; Slack for Enterprise coming soon
6 – COMMUNITIES
An online community is defined by the underlying connections between members. In social networks, people are typically held together by pre-existing relationships: family, friends, neighbors, colleagues, alumni, neighbors, etc. Online communities consist of people with no pre-existing relationship; instead, they are held together by a common interest.
Another key difference between an online community and other social networks is that the underlying relationships in a community are one to many. On social networks, each user has his or her own network of connections, which are a subset of the entire platform. This isn’t the case with communities.
Community examples: Reddit (news), Last fm (music), Goodreads (books), Flixter (movies), Overtime (sports), and Stack Overflow (productivity)
A BRIEF HISTORY OF ONLINE COMMUNITIES
Before the Internet, bulletin board systems (BBS) were all the rage. First conceived in 1978, they used a computer server running custom software that allowed users to connect to the system using a terminal program. Users uploaded/downloaded software and data, read news and bulletins, and exchanged messages with other users.
“Sure, connecting to someone on BBS meant dialing into a phone line through your Trash-80 PC, typing a message in your monochromatic terminal and waiting days — sometimes even weeks — before you repeated the process to (hopefully) find a reply, but holy cow, look! You’ve got digital friends.”
Not surprisingly, these early systems were mainly populated by hobbyists and computer enthusiasts. As a result, BBSs typically consisted of very technical postings, software downloads, and primitive games.
Early BBSs used traditional phone lines to log into remote computers. Dialing into a BBS outside of your area resulted in long-distance phone charges. When dial-up Internet service became widely available by 1995, it meant the end for BBS. A single connection to an ISP allowed users to contact services around the world. In addition, the Internet let the same connection be used to contact multiple services at the same time. For example, you could download files from an FTP library while checking a local news website. But, a connection to a BBS allowed access only to the information on that system.
The mid-nineties marked the golden age of the Internet chat room. Services like MSN and AOL packaged chat applications into their dial-up subscription packages. By 1997, AOL had an estimated 19,000 chatrooms and users were spending more than a million hours chatting each day. AOL’s chief architect Joe Schober described the earliest chat rooms as “little frontier towns.”
What happened to those chat rooms? DSL made AOL’s subscription model obsolete. And new paradigms were emerging for social networking (Friendster and MySpace), as well as direct messaging (web, then mobile).
The Washington Post described the demise of chat rooms:
“In some ways, in fact, chatrooms were experiencing a cultural shift similar to one much-discussed on Facebook today: a space that was once a frontier, was being standardized, monetized — colonized by moms. And the places that remained
on the fringes were categorically gross: full of spam and sludge and a/s/l-style solicitation, a far cry from the supportive communities of the late ‘80s.”
ONLINE COMMUNITIES TODAY: DYNAMICS
Why do people join communities?
Before diving into the dynamics of online communities, it’s important to understand what motivates people to join and participate in communities in the first place. Common reasons are:
- They share similar interests with the community
- They want to contribute to the community
- They benefit from the community — for example, by gaining a sense of belonging or finding content of interest
Highly verticalized
Online communities range from celebrity fan sites to industry-specific business networks. The nexus of these communities is a shared interest: an “interest graph” rather than “social graph.”
While your social graph on Facebook might be large, not all of your Facebook friends share your same interest in beer, architecture, English Premier League, cats, or whatever else. In real life, you consider yourself a member of many different communities and have many different interests. Participation in online communities is the digital reflection of this.
This means that by nature, an online community is highly verticalized. It provides an outlet for a specific aspect of your life. However, while a community will have dedicated and active members, it’s also harder to scale because the total addressable market is limited to the subset of people interested in the particular niche.
In addition, unlike platforms like Facebook and LinkedIn, communities aren’t networks of networks. There’s little cross-pollination across communities (low virality). The people you chat with in your running community won’t necessarily be interested in joining a baking community. We each have a unique set of interests and hobbies and compartmentalize them.
Communities are utilitarian
People are attracted to communities for the content. Major networks like Facebook and Twitter can be incredibly noisy, with general content across a broad range of topics based on the interests of your social graph. Since a community centers around a specific area, content relevance and depth take precedence. Content serves as the initial trigger for joining a network and fuels the community over time, providing context for conversations between members.
Communities are subject to the 90-9-1 Rule
Online communities are subject to the 90-9-1 Rule that we first introduced in the Public Networks chapter. On average, 1 percent of members actively contribute (post, initiate a discussion, share content); 9 percent contribute a little (interact with posted content), and 90% of members lurk. For example, 80 to 90 percent of Reddit’s users never create an account. And as with public networks, online communities grow in value if they can turn lurkers into participating members.
Communities and the “chicken and egg” problem
Like a marketplace, an online community faces the chicken and egg problem with supply and demand. How do you convince people to visit, join, create, and invest their time when there’s not a lot happening on your site?
As we discussed previously in the Public Networks chapter, one key to bootstrapping your community is to start with the highest value use case, even if it’s a small niche, rather than tackling the mainstream use case first.
Some communities end up seeding the early content until they reach a critical mass of user activity. Reddit initially created fake profiles posting links. This not only gave the appearance of popularity early on, but the initial content attracted people who were interested in that content and set the culture early on.
Reddit co-founder Steve Huffman explained: “We were submitting content that we would have been interested in seeing. That meant the content on Reddit … was good. And when you show up, you know exactly what the site is about.”
Managing communities is tricky
Managing communities can be tricky business, as evidenced from the massive uproar when Reddit fired Victoria Taylor, who coordinated Ask Me Anything (AMA) and served as the go-between person between moderators and communities. In response to her firing, more than a hundred subreddits shut down in protest.
To its members, a community becomes far more than a product or service. In some cases, a community is an integral part of members’ lives and identity. This is particularly true when members of the community volunteer as moderators. Changes are never taken lightly, and community startups need to think carefully about how they announce and roll out any changes. An abundance of communication and transparency typically helps foster buy-in of any changes.
In addition, a good moderation policy is core to the community’s culture and needs to be instituted from day one. The first 1,000 people in a community set the tone and once that early culture is set, it is very hard to change. Communities need to institute a zero tolerance approach toward any unwanted behaviors during the early days.
BUSINESS MODELS FOR COMMUNITIES
Ads
Advertising is the core revenue source for online communities since they serve up a targeted audience for advertisers. For example, brands can reach dog lovers on Dogster or women aged 50+ on ThirdAGE.
Generally speaking, it’s hard to scale an online community based on advertising alone. Why? Targeting is relatively high level. You can target the audience based on the focus of the overall community, but usually can’t dive any deeper into the demographics of each user. Then, there’s the added issue that communities have a limited reach.
Distribution platform
Online communities represent a powerful platform for content distribution and commerce. User content can offer inspiration, while the community itself offers social validation and recommendations, two important drivers in online commerce. For example, Houzz combines design inspiration with e-commerce (links to products) and paid recommendations/advertising for service providers .
7 – SOCIAL PLATFORM METRICS
As a social platform grows, it’s important to understand how the business is performing, what’s working well, and what needs to be changed. Numerous blog posts and articles talk about metrics for specific social platforms. The problem, however, is that these resources are quite fragmented because each social platform is unique. There are big differences between a messaging app like SnapChat, a private social network like LinkedIn, and a community like Reddit.
Our aim in this chapter is to provide a standard framework in which we can think about social platforms… because despite the uniqueness of each individual platform, there are still important commonalities.
To that end, we created a KPI dashboard for social platforms. We hope this tool helps you manage your business and preempt many of the due diligence questions that arise during a fundraise.
You can access the social platform KPI template via the Google doc here. Make a copy of it and then you can edit away.
You’ll see that the dashboard is divided into three main areas:
- High-level metrics
- Measuring engagement by content
- Measuring engagement by relationships
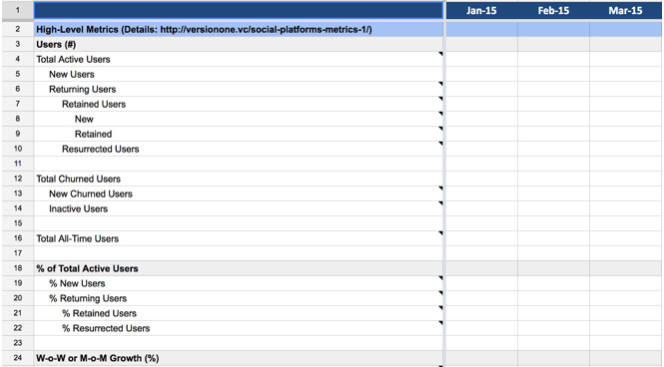
Our KPI dashboard for Social Platforms: access the Google spreadsheet here
PART I: HIGH-LEVEL METRICS
Since social platforms are defined by engagement, the key metrics to consider are:
- Daily active users (DAU): The number of unique users who engage with the product in the past 24 hours
- Monthly active users (MAU): The number of unique users who have engaged with the product within the previous 30 days
- DAU/MAU: The “stickiness” ratio that tells you what percentage of your monthly active users come back on a daily basis. This is a critical metric, since there’s a big difference between users who are slightly active (engage once or twice a month) vs. really active (e g engage 20+ times per month). For example, a DAU/MAU of 50% would mean that the average user is engaged 15 out of 30 days of the month. Ideally, you want this number to be above 30-40% to have a highly engaged platform. To calculate DAU/MAU, take the number of unique users at the end of a given day and divide it by the number of unique users for the last 30 days, including the day in question. At Facebook, days active in a month is called L28. For example, L28=10 means that the user was active for 10 days of the last 28.
Note that the benchmark for “active” can vary: some apps record this when a user simply visits a site while other apps only consider a user to be engaged when he or she logs in and performs another action.
In addition, the total number of active users on your platform at the end of a cycle (e g day, week, month) can be viewed as a sum of the following:
Total Users = New Users + Returning Users
- New users: Should be self-explanatory
- Returning users: Retained users + Resurrected users
- Retained users: Active users this cycle who were also active last cycle
- Resurrected users: Active users this cycle who weren’t active in the previous cycle
From here, you can calculate % new users, % retained users, and % resurrected users relative to the total number of active users. You can also compute growth in these categories, from which you can see how effective your growth, engagement, and re- engagement campaigns are.
If you want a deeper understanding of your retained users, you can break this down in a similar manner: “new” (i.e. new users in the last cycle who are active this time) + “retained” (i.e. users who continue to be active this cycle as they were previously).
On the flip side of engagement, we can look at churn as a measure of the number of individuals moving out of a collective group over a specific period of time. Churned users can be segmented as follows:
Total Churned Users = New Churned Users + Old Churned Users
- New churned users: Inactive users in the current cycle who were active in the previous cycle
- Old churned users: Inactive users from the previous cycle(s) who continue to be inactive in this cycle
Knowing the number of users that have churned allows you to calculate your churn rate.
Churn Rate = # of users churned at the end of the time period / # of total users at the beginning of the time period
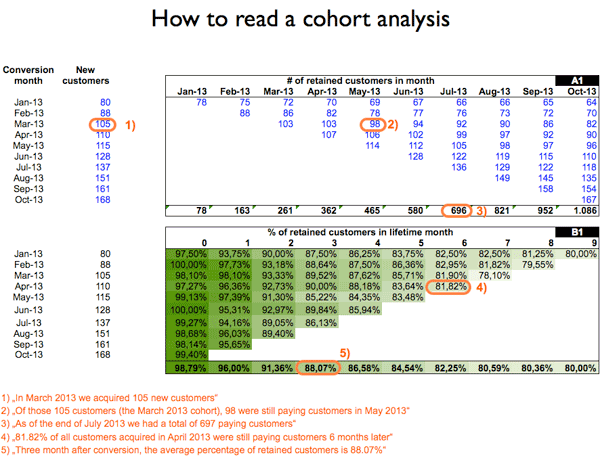
After we understand engagement and churn, we can perform a cohort analysis. Rather than looking at all users as one unit, this analysis breaks users into related groups or cohorts which usually share common characteristics or experiences within a defined timespan.
We won’t recreate the wheel here as our friend, Christoph Janz of Point Nine Capital published a great template on Andrew Chen’s blog. While his post is catered to SaaS, the concept is still relevant to social platforms; just substitute “paying customers” with “active users.”
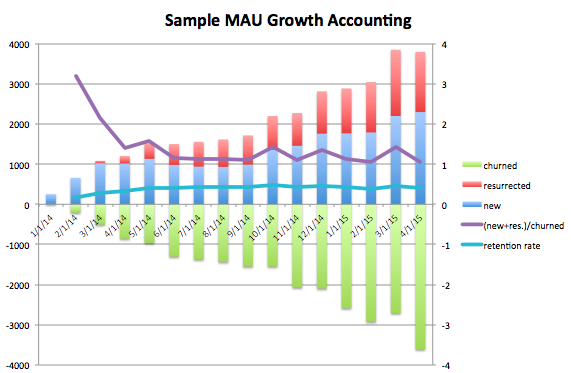
Another great way to understand your data is to visualize it. Jonathan Hsu wrote about how he and his team at Social + Capital perform due diligence and shared a helpful “growth accounting” graph that summarizes most of the data above.
And finally, for high-level metrics, make sure you track customer acquisition cost (CAC) and how much and what percentage is organic versus paid, net promoter score (NPS), lifetime value (LTV) and average revenue per user (ARPU). The cohort analysis spreadsheet by Christoph helps with this too.
PART II: MEASURING ENGAGEMENT BY CONTENT
When we’re talking about the high-level metrics in Part 1, a user is considered “active” if they’re somehow engaging with the product. But, there’s no difference between a user that logs into the platform once or creates content every single day.
With social platforms, you need to dive deeper into your users to understand not just the total volume, but also the quality of these users and what it means to be engaged.
Defining engagement on your platform
The first step is to create a list of actions that a user can perform on your platform. Here are some examples of events to record. Note that this is not a comprehensive list nor are all events applicable to every social platform.
- Account created: When a user creates an account
- Account verified: When a user’s account is successfully verified
- Profile created: When a user creates a profile
- Profile completed: When a user completes his/her profile
- User sign-in: When a user signs onto the platform (note: most platforms now have auto sign-in so users are always logged in)
- User sign-out: When a user signs out of the platform
- Content created: When a user posts text, a URL, or an image (track this by content type)
- Content viewed: When a user views content
- Content shared: When a user forwards content to others (track this by internal sharing and external sharing)
- Content upvoted: When a user “likes” or “favorites” content created by another user
- Comment added: When a user responds to content created by another user
- Comment upvoted: When a user “likes” or “favorites” another user’s comment to content
- Following: When a user “follows” another user or content thread
- Followed: When a user is “followed” by another user
- Connection requested: When a user requests to “friend” another user (in the case where relationships require a double opt-in)
- Connection made: When a user accepts a friend request, or when a user follows another user who follows him/her back
- Group created: When a user creates a group
- Membership requested: When a user asks to join a group
- Membership granted / group joined: When a user successfully joins a group
- Message sent: When a user sends a message to another user (you can also separate public and private messages)
Once you have this list, you can create a framework of engagement. Consider this your engagement pyramid which organizes a user’s behavior in a hierarchy.
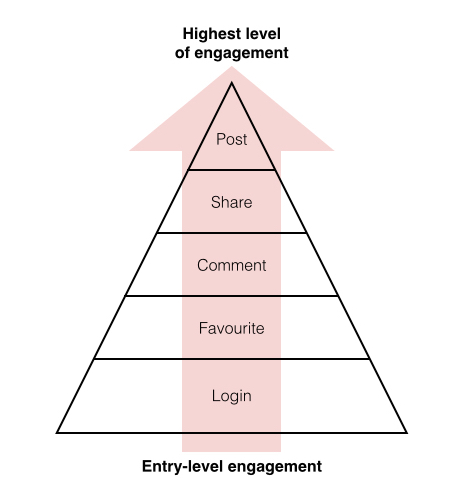
At the top, place the activity that you determine to be a sign of someone who is most engaged with your product. This is your core action For example, it’s pinning on Pinterest or snapping on Snapchat.
Next, consider all the other activities that someone can do, and place them in decreasing order from what requires the most energy and has the most friction for someone to do, to what is easiest.
By doing this, you can identify the highest level of user engagement and subsequently, allocate resources to achieve that outcome.
As we discussed earlier, the network effects on social platforms are, in fact, two-sided. Participants generally follow the 90-9-1 rule, with 1% creating content, 9% engaging with it, and 90% just consuming it.
Since user-generated content is king on social platforms, the most active users (creators) are those who post status updates, photos, or links that drive others to come to the platform time and time again. These creators are inspired when they are recognized for their contributions via shares, comments, favorites, etc. In addition, more content and engagement create more value for users on the platform, thus encouraging more activity and engagement.
Build your engagement dashboard
Now that we have defined engagement, the next step is to understand how “healthy” that engagement is. From the list above, you can build a content engagement dashboard similar to what we did for the high-level metrics.

KPI dashboard for Social Platforms: access the Google spreadsheet with content engagement metrics here.
For instance, on a monthly basis, you can tally all the “positive actions.” Let’s use images as our example In this case:
- Total images uploaded to date
- New images uploaded this month
- % image growth (WoW, MoM, etc )
- Average images uploaded per user (mean and median)
- Average comments per image
- Average upvotes per image
- Average shares per image
However, don’t stop there. We recommend understanding the distribution of these actions (i.e. plot a histogram). You can calculate useful metrics like:
- % of users who have uploaded an image at least once, 2x, 5x, 10x in the past week, month, or year
- % of users responsible for uploading 80% of all images
- % of users who have engaged with images at least once, 2x, 5x, 10x in the past week, month, or year
and so on…
We also recommend that you track your user journey while using the platform in order to understand if some actions tend to lead to others and where improvements can be made to encourage people to be content creators.
PART III: MEASURING ENGAGEMENT BY CONNECTIONS
When building your platform, consider how much users care about the people that they are interacting with and whether the communication is bidirectional. Are the relationships pre- existing from an offline social graph or new ones generated online?
We feel that stickiness is not only a function of common interests, but also the depth of relationships on the platform. This is probably one of the reasons why anonymous social networks have not scaled in the past (e.g. Secret).
Here’s a sample of our KPI dashboard, which includes metrics for relationship engagement:
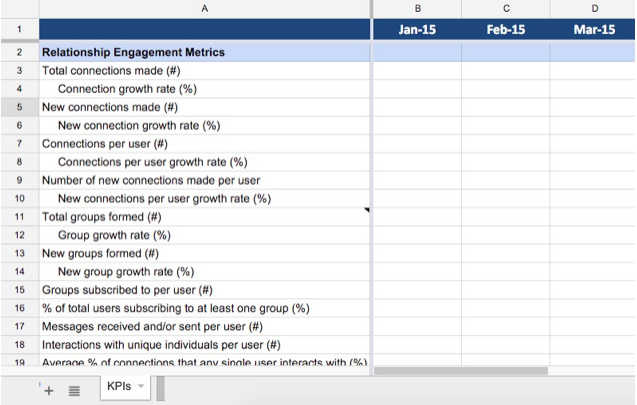
Our KPI dashboard for Social Platforms: Relationship engagement metrics
Some examples of key relationship metrics to track are:
- Total number of connections made (in the case of public social networks like Twitter that use the “follow” model, you may want to count both the number of one-way follows and two-way follows)
- Number of new connections made
- Number of connections per user (plot a distribution)
- Number of new connection made per user (this gives you a sense of virality)
- Total number of groups (public or private sub social-networks with 2+ people)
- Number of new groups
- Number of groups subscribed to per user
- Number of messages received and/or sent per user
- Number of interactions with unique individuals per user
- Average % of connections that any single user interacts with
- Averages and % growth rates for all these metrics
Based on these metrics, you can identify which users have a strong influence on others. Then, follow these users’ journeys to learn from their behavior and actions.
Main Takeaway: Our thesis is that social platforms are sticky due to two things:
- Unique, user-generated content
- Strong underlying relationships between users
As you build your social platform and track your key metrics, ask yourself the following: How can you drive daily engagement to your platform? Can you do it with content only (in the case of a community) or do you also need to focus on building relationships between users?
VIRAL COEFFICIENT (K)
There is one form of marketing and user acquisition that trumps all others: when a user recommends your site or app to their friends, colleagues, and family. This is why the viral coefficient (K) is a vital metric for social platforms.
The viral coefficient tells you the number of new users that each existing user brings in. A viral coefficient of 10 means that on average, each current user brings 10 new users to your platform.
K = i * c
Where
- i= Number of invites sent by each customer. This represents the average number of invites sent per user.
- c= Percent conversion of each invite (e.g. if one of five invitees convert to a new user, then c=0 2)
Calculating the viral coefficient
The AppVirality blog offers a relatively straightforward way to think about your viral coefficient.
- Take the number of your current customers. Let’s say that’s 100.
- Multiply this number by the number of invites your current customers send to their friends. If yours is an online business this shouldn’t be a problem. If it is offline, you have some research to do to acquire the necessary stats. Let’s say you find that each customer invites 15 of his friends.
- Find the percentage of those invitees who became your new customers. Let’s say that’s 10%.
So if 100 of your customers sent out 15 invites each that becomes 1,500 invites. Then if 10% of them became your new customers then that is 150 new customers.
You started with 100 customers and you gained 150 extra customers. Divide the number of new customers acquired by the number of existing customers and you have your viral coefficient. So in our case it will be 150/100 = 1.5.
The Viral Coefficient must be greater than one to have viral growth.
Think of viral growth as a cycle: current users send out invites, new users sign up, those new users send out invites, and more new users sign up.
If you think of it this way, it becomes clear why keeping the viral coefficient above 1 is the goal. If it is less than 1, over time you will have to spend more money on acquiring new customers because: x^n ->0 when x<1 and n=number of cycles.
Viral cycle time
When thinking about your Viral Coefficient, you also need to consider Viral Cycle Time. This is how quickly users sign up, send out invites, and convert others. In “Lessons Learned – Viral Marketing,” David Skok compared YouTube to Tabblo to illustrate the importance of this variable. Both companies experienced viral growth, but at vastly different scales.
“In YouTube’s case the Viral Cycle Time was extremely short: a user would come to the site, see a funny video, and immediately send the link on to their friends. Tabblo, on the other hand, had a much longer cycle time. A customer would
post some photos on the site and invite their friends. The friends might see the photos on Tabblo, and like the experience and decide that they would use the site the next time they took photos they wanted to share. However, that is where the problem came in: it could take months before they next took photos, and decided to share them.”
In his post, Skok put together a model that demonstrates just how important Viral Cycle Time is to customer growth.
“For example, after 20 days with a cycle time of two days, you will have 20,470 users, but if you halved that cycle time to one day, you would have over 20 million users! It is logical that it would be better to have more cycles occur, but it is less obvious just how much better. A quick look at the formula tells the whole story. The Viral Coefficient K is raised to the power of t/ct, so reducing ct has a far more powerful effect than increasing K.”
The bottom line:
- Increase the number of invites sent out
- Improve the conversion rate for those invites
- Shorten the time needed for new users to use the platform, and send out their round of invites
And remember: a platform does not have viral growth unless it has a Viral Coefficient greater than one.
8 – EXITS AND VALUATIONS
Considering that social media sites consistently rank among the most trafficked properties on the Web, it’s not surprising that social media exits often lead the tech deals within a year. Whether it’s the Line IPO or Facebook’s acquisition of WhatsApp, social network exits grab big headlines.
However, what are the real exit options for social networking startups? How long does it take to go public? And how are social platforms valued? We’ll discuss IPOs, M&A activity, and valuations in this chapter.
SOCIAL NETWORK IPOS
Mahesh Vellanki of Redpoint Ventures charted years to IPO across a typical sample set of Internet companies. He found that the overall median time from founding to IPO is 8 years. The social network companies took about this long, but as he noted, LinkedIn, Facebook, and Twitter were mega-IPOs and the companies may have been able to go public sooner if they wanted. Generally speaking, social exits are earlier than marketplaces and SaaS.
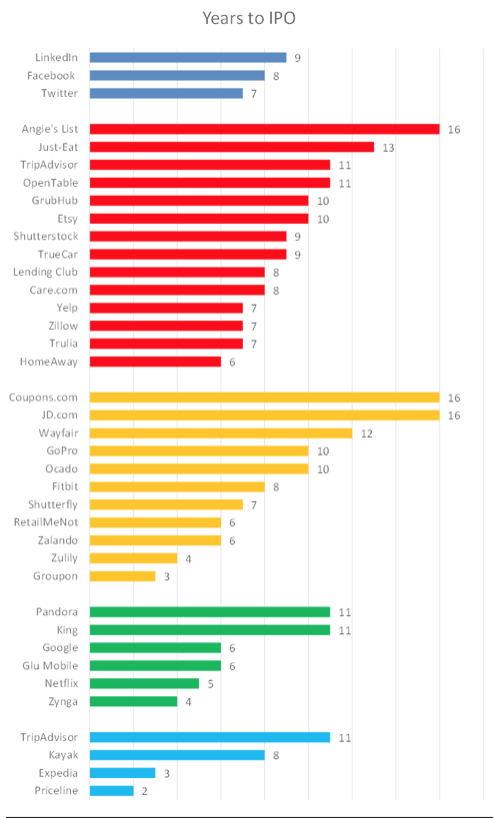
Source: Redpoint Ventures
When Mahesh looked at company revenue before and after an IPO, Facebook, LinkedIn, and Twitter all had 100-200% annual growth 1-2 years prior to IPO, and continued to grow well afterwards.
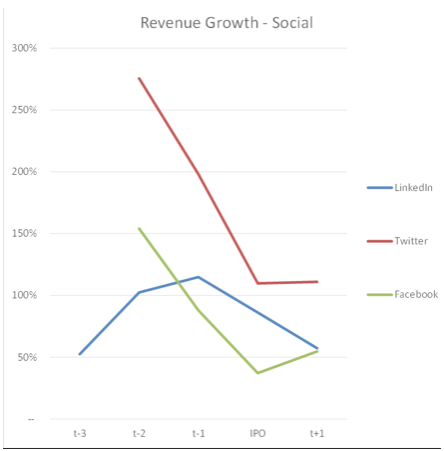
Source: Redpoint Ventures
When social networks hit it big, they can become huge IPOs. However, only the aforementioned big three have reached this point in North America. You may have noticed that there were far fewer social network companies listed in Mahesh’s chart than marketplaces and SaaS companies.
In fact, if we look at the top twelve social-app exits to date, six are based outside the US. Line is based in Japan, Vkontakte is Russian, Kakao is from South Korea, Renren is from China, and Skype and Viber are registered in Europe.
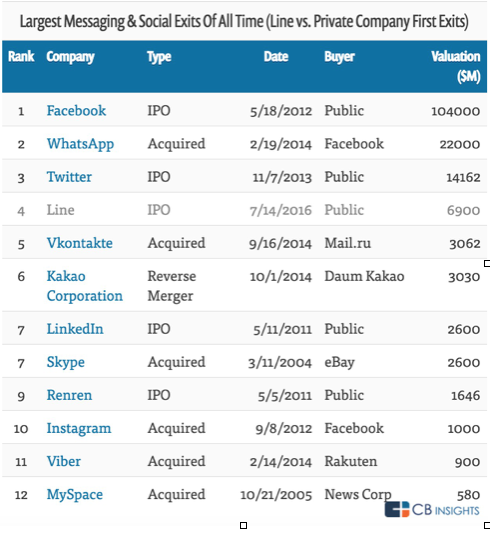
Source: CB Insights
While there have been few IPOs for social networks, aggressive M&A activity has led to heavy consolidation over the years. This is in stark contrast to the marketplace arena where acquisitions are few and far between.
Facebook has made over 50 acquisitions, including WhatsApp ($22B, 2014) and Instagram ($1B, 2014). In most cases with Facebook, acquisitions turn out to be “acqui-hires” where the acquired products are shut down shortly after. WhatsApp and Instagram are two big exceptions to that trend.
Likewise, Twitter has acquired more than 50 companies, including Periscope (2015) and Vine (2012). Other notable acquisitions in this space include Yahoo/Tumblr, Google/Waze, Microsoft/Yammer, Google/YouTube, and now Microsoft/LinkedIn.
All this M&A activity is partly driven by the desire for synergy: if a larger social network buys a smaller one, it can instantly introduce the new app to its large user base and accelerate growth virtually overnight. This is what Facebook has done with Instagram and Twitter
with Periscope.
In addition, Facebook has been very aggressive to neutralize every new social platform that has emerged with scale: it successfully gobbled up Instagram and WhatsApp, and tried to buy Snapchat.
HOW DO INVESTORS VALUE SOCIAL NETWORKS?
We are often asked about how to determine the valuation of a social network company that is starting to scale. Valuing social startups, particularly consumer social startups, is tricky business: platforms can have explosive growth in users, coupled with a poorly developed business model.
In another great post, Mahesh Vellanki outlined two sample methods for triangulating the value of a social startup by comparing it with comparable consumer apps.
In one example, he looks at equity per user. His fictional high growth mobile app (Company X, shown at the bottom of the chart) has 10M monthly active users (MAU).
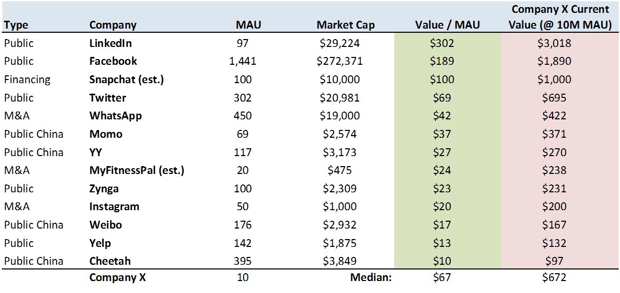
Source: Redpoint Ventures
As you can see in the chart, the Value/MAU ranges from $10 with Cheetah all the way up to
$302 with LinkedIn. If the fictional company is more like LinkedIn, Facebook, or Snapchat, then it would be valued well over the billion dollar mark. But if it’s more similar to Cheetah Mobile or Weibo at the lower end, its valuation would be around a couple of hundred million dollars.
Given this broad range, we look at two key factors when evaluating a social platform:
Retention/engagement
As we first introduced in Chapter 1, we consider engagement to be the most important metric for social platforms, and we look at the DAU/MAU ratio (“stickiness ratio”) above everything else. What percentage of your monthly active users come on a daily basis? To be considered highly engaging, this number should be above 30-40%. Of course, we also dive deeper into metrics beyond DAU/MAU, such as measuring user engagement by content, actions, and underlying connections. These have been covered in Chapter 7, Metrics.
Monetization potential
Monetization of social networks follows a very broad distribution. Referring to the chart above, there’s a 30x difference between the monetization of the different platforms and user groups. When we think about monetization potential on social platforms, we’re looking at two things:
- Purchasing power of the user group. For example, it’s tough to monetize teens. But on the other end of the spectrum, Figure 1 (one of our portfolio companies) is a vertical network for doctors, a group which tends to have high spending power.
- Potential to engage users with ads: Native ads work very well on Facebook, since they can become an extension of the newsfeed; however, it’s a much different story on Reddit.
While it’s difficult to plug numbers into one single equation to come up with a meaningful valuation for a social platform, we are able to assess platforms by looking at retention and monetization potential.
9 – OPPORTUNITIES
The strong network effects in social networks make it hard to unseat incumbents. As we’ve said before, it’s difficult to convince someone to leave their 300+ friends on Facebook and start over on a brand new platform. It’s this moat that makes network effect companies so attractive to investors and entrepreneurs. Once an incumbent or two establish themselves, there’s little room for anyone else.
However, we don’t believe that opportunity in social networking is dead. There are still possibilities out there for good companies to…
- Ride out the last vestiges of the original social wave through vertical niches
- Build on the current wave of messaging as a platform/conversational UI
- Jump on brand new social waves sparked by new technology
RIDING OUT THE OLD WAVE: NEW OR UNDER-REPRESENTED VERTICALS
Over the years, verticalization has been a big trend in the social space, with niche sites catering toward interests, locales, and professions. It seems like every week, TechCrunch writes about the launch of a new “Instagram for X” or “LinkedIn for X” where X ranges from doctors, teachers, finance professionals, academics, dog lovers, travelers, etc. This means that much of the white space has already been filled in.
However, there’s still opportunity through a vertical approach if 1) the underlying market is big enough and 2) there isn’t already a social network catering to the specific user group. Figure 1 (a V1 portfolio company) found this opening in healthcare.
Teddy Citrin of Greycroft recently wrote about the Spawn of Facebook Groups, continuing Andrew Parker’s original meme, the Spawn of Craiglist, which showed how vertical marketplaces were forming around Craigslist categories. Multi-billion dollar marketplace
companies sprung up around Craigslist categories. A similar trend is happening around Facebook Groups: large vertical communities are forming around Facebook Groups’ most active categories.
It’s important to realize that verticals themselves aren’t static. There’s always a potential to build a social network around an emerging vertical. For example, Twitch’s success was aided by the rise of eSports (aka professional video gaming).
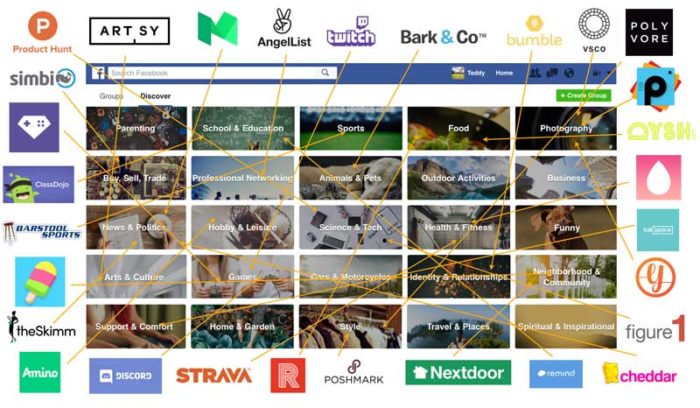
Source: Teddy Citrin, The Spawn of Facebook Groups
In addition, the enterprise is still a nascent area for social networking. Enterprise apps have traditionally focused on improving productivity and workflow, while increased collaboration has been a helpful side effect. However, we believe that the next generation of productivity apps will be social first, since most work is not done in a silo’ed environment. Current examples are Slack, Github, Abstract, and Amium. Apps that can successfully unlock collaboration will improve productivity and find a foothold in the enterprise.
While we believe there is strong potential to build social in the enterprise, the unanswered questions are:
- How can you actually unlock collaboration?
- Is collaboration vertical or horizontal? Does it touch many parts of the organization or just a specific department or team?
BUILDING ON THE CURRENT WAVE: MESSAGING AS A PLATFORM
Messaging as a Platform is a hot area right now. In China, WeChat users get movie tickets, check their bank statements, reserve a hotel room, and schedule an appointment with their doctor through the “messaging” app. But a dominant messaging app still hasn’t emerged in North America and companies, as well as investors, are eager to replicate WeChat’s success.
Facebook Messenger, Google Allo, and Apple iMessage are all opening up their platforms. This doesn’t leave much of an opportunity for a newcomer to build a new messaging platform. However, there are plenty of opportunities to create products that leverage the existing messaging apps as an interface.
The key question is: when is messaging the optimal way of getting things done?
One of the big unknowns is if the command line (or chat bubble) of a chat app is going to offer a better experience than an app. In some cases, the conversational approach of chat is the best solution for accomplishing a task; in other cases, it’s cumbersome and inefficient. After all, there’s a reason why we moved from DOS to Windows.
We have no doubt that we’ll be interacting with brands and companies via a messaging app more frequently in the near future. However, just because something happens inside a chat app doesn’t necessarily mean it needs to take on a pure conversational UI.
Conversational commerce might be best when 1) it’s a completely new use case (i.e. it’s not already defined like hailing an Uber), and 2) it’s not that complex of a transaction. For example, we believe that Trim, a V1 portfolio company, is ideally suited for conversational commerce. Trim has built a money-saving robot that starts by cancelling those unwanted subscriptions. In this case, the simplicity and approachability of messaging are what make Trim work so well.
Sample screen grab from Trim
As more interactions between brand and customer take place within a chat window, it’s only natural that Messaging as a Platform will evolve from a customer service touchpoint to an important m-commerce channel, where entire transactions are completed within the platform. For example, when customers already have their payment details stored within the app, they can easily order a new sweater, smartphone, movie tickets, or Uber from a chat. We expect to see strong opportunities for m-commerce within messaging platforms.
It’s also a matter of time before messaging platforms will build marketplaces on top of their social networks and take a share of each transaction.
CREATING A NEW WAVE: THE FUTURE
As with any industry, the biggest opportunities are found at the cusp of a new wave of innovation. Mobile sparked the creation of both messaging and photo app categories (both activities are native to the phone).
Social AR and VR
The emergence of augmented reality (AR) and virtual reality (VR) will likely change how we interact with others and represent the next wave of innovation in social. Facebook is aggressively pursuing AR/VR technology. The company acquired Oculus in 2014 for about $2 billion and has created a “Social VR” team to focus on building ways for people to have social experiences in VR and to engage with Facebook in virtual settings. AltspaceVR is popular and Rec Room has impressive engagement numbers. There’s also VRChat, High Fidelity, and JanusVR, as well as “YouTube for VR” apps like Vrideo and Littlstar.
The question is which native social behaviors on VR/AR will become the next big thing, just like messaging and photo apps took off with mobile? It’s still too early to predict how social will manifest itself in this new AR/VR age, but we’re interested in seeing how a more immersive social experience can lead to new ideas and products.
Blockchain and social
Another emerging area of interest surrounds blockchain technology, particularly cryptographic tokens. As Albert Wenger explained, “You can think of these like the tokens you might buy at a fair to get on a ride: different operators can have their own rides and set their own price in terms of tokens. You only need to buy tokens once (in exchange for fiat currency) and then can use them throughout the fair.”
In the coming years, we expect to see significant resources dedicated to innovating new protocols for cryptographic tokens as a new form of digital currency. This development will certainly have an impact on social networks. First, Blockchain technology has the potential to redefine identity, which is at the core of social networking. For example, Blockchain startup Onename lets you create a blockchain-tied profile. And, crypto tokens will have an impact on monetization Micro-donations are already used on platforms like Twitch where viewers give small donations to broadcasters. Wider use of crypto tokens will open up new ways of supporting user content, purchasing virtual goods and more.
Passive social
Scott Belsky predicts that social will become passive. He writes: “The concept of actively ‘posting’ or ‘sharing’ will be frowned upon and entirely replaced by a passive stream of your life’s experiences, whereabouts, and media consumption.”
In this world, contextual social products will pop in and out of our daily lives, automatically sharing aspects of what we’re doing and where we are, for example, at a restaurant, working out, traveling, etc. The idea of passive social bears interesting implications for new social products and new forms of advertising.
Conclusion
At Version One, we’ve centered our investment thesis around companies that leverage strong network effects. We have talked at great lengths about network effects in marketplaces, as well as data network effects in artificial intelligence and machine learning startups.
Social platforms can have incredibly strong network effects, but until this book, we’ve been relatively quiet on the subject. Yet our silence doesn’t mean we believe that the space has peaked or that social is irrelevant.
In the previous chapter, we discussed some of the key areas where we’ll be keeping a close eye in the years ahead. But beyond specific verticals and applications, the promise of social platforms is much more fundamental. Humans have an innate need to interact with others. As a result, there will always be room for companies to dream up new ways to help us connect, share, learn, and participate. That’s why we’re bullish on social.
We have invested in social network companies like Abstract, Edmodo, Figure 1, Shift Messenger, and Wattpad. With each company, we’re learning more about social network success strategies. We’re excited to be active investors in this space and are looking forward to the journey ahead.
Resources
Introduction
“28% of Time Spent Online is Social Networking.” Shea Bennet, SocialTimes. January 27, 2015. http://www adweek com/socialtimes/time-spent-online/613474
“Number of daily active Facebook users worldwide as of 3rd quarter 2016 (in millions).” Statista. https://www statista com/statistics/346167/facebook-global-dau/
Chapter 1
“Ad Effectiveness Study Reveals Native Ads Drive More Attention and Brand Lift Over Traditional Display.” Sharethrough/IPG Media. http://www sharethrough.com/resources/in-feed-ads-vs-banner-ads/
Chapter 2
“Epic slide deck from former Yahoo board member lays out the future of tech and media.”
Nathan McAlone and Tess Danielson, Business Insider. October 21, 2015.
http://www businessinsider.com/michael-wolf-predicts-what-will-happen-in-the-tech-industry-in-2016-2015-10
“Number of monthly active WhatsApp users worldwide from April 2013 to February 2016 (in millions).” Statista https://www.statista com/statistics/260819/number-of-monthly-active-whatsapp-users/
“Facebook forced us to use Messenger, and it worked: 500M monthly users and counting.” Harrison Weber, VentureBeat. November 10, 2014. http://venturebeat.com/2014/11/10/facebook-forced-us-to-use-messenger-and-it-worked-500m-people-now-use-it-every-month/
“Life in the People’s Republic of WeChat.” Dune Lawrence, BloombergBusinessWeek. June 9, 2016. http://www bloomberg.com/news/articles/2016-06-09/life-in-the-people-s-republic-of-wechat
“Kakao Pay passes 5M users in its first 12 months.” Michael De Waal-Montgomery, VentureBeat. September 15, 2015. http://venturebeat.com/2015/09/15/kakao-pay-passes-5m-users-in-its-first-12-months/
“The Messaging Phenomenon Has Hardly Begun.” Stephanie Newman, Medium. November 23, 2015. https://medium.com/the-activate-outlook/the-messaging-phenomenon-has-hardly-begun-cdaeaf735cb2#h7pjl4el0
“Messaging and mobile platforms.” Benedict Evans, Ben-evans.com. March 30, 2015. http://ben-evans com/benedictevans/2015/3/24/the-state-of-messaging
“Messaging Apps Like LINE, WeChat Face A Revenue Problem.” Parmy Olson, Forbes. June 11, 2015. http://www.forbes.com/sites/parmyolson/2015/06/11/messaging-apps-wechat-whatsapp-facebook-revenue-problem/#7e4456be1b2f
“Internet Trends-2015 Code Conference.” Mary Meeker, KPCB. May 27, 2015. http://www slideshare.net/kleinerperkins/internet-trends-v1
“Making WhatsApp free and more useful.” WhatsApp Blog. January 18, 2016. https://blog.whatsapp.com/615/Making-WhatsApp-free-and-more-useful
“Snapchat Is Asking Brands for $750,000 to Advertise and Won’t Budge.” Garett Sloane, AdWeek. January 14, 2015. http://www.adweek.com/news/technology/snapchat-asks-brands- 750000-advertise-and-wont-budge-162359
“Line sold $268 million worth of stickers last year amid Asia’s messaging boom.” Zachary Seward, Quartz. June 12, 2016. http://qz.com/704768/line-sold-268-million-worth-of-stickers-last-year-amid-asias-messaging-boom/
“The Elements of Stickers.” Connie Chan, http://a16z.com. June 17, 2016. http://a16z com/2016/06/17/stickers/
“China’s Xiaomi sold 150,000 smartphones in under 10 minutes… using a chat app.” Kaylene Hong, TheNextWeb. November 28, 2013. http://thenextweb.com/asia/2013/11/28/chinas- xiaomi-sold-150000-smartphones-10-minutes-using-chat-app/#gref
“Screw Texting It’s time to pick a universal messaging app.” David Pierce, Wired. August 6, 2015. https://www.wired.com/2015/08/time-to-ditch-texting/
“Facebook Bots 101: What They Are, Who’s Using Them & What You Should Do About It.” Meghan Keaney Anderson, HubSpot Blog. June 7, 2016. http://blog.hubspot.com/marketing/facebook-bots-guide#sm0001g4u8r2eozehsxs42o3rvggm67
Chapter 3
“MOL Global to Acquire Friendster.” PRNewswire. December 9, 2009. http://www.prnewswire.com/news-releases/mol-global-to-acquire-friendster-78932997.html
“Facebook Gets Strong Majority of World’s Social Ad Spending.” eMarketer. July 25, 2016. https://www.emarketer.com/Article/Facebook-Gets-Strong-Majority-of-Worlds-Social-Ad-Spending/1014252
“Facebook puts friends above publishers in “News Feed Values” and ranking change.” Josh Constine, TechCrunch. June 29, 2016. https://techcrunch.com/2016/06/29/facebook-news-feed-change/
“Building a Better News Feed for You.” Adam Mosseri, Facebook Blog. June 29, 2016. http://newsroom.fb.com/news/2016/06/building-a-better-news-feed-for-you/
“LinkedIn’s sponsored content pivot helps ad revenue hit $154 1 million.” Tim Peterson, Marketing Land. April 28, 2016. http://marketingland.com/linkedin-q1-2016-earnings-175092
Chapter 4
“The 1% rule and why it still matters.” Ramy Khuffash, Medium. April 1, 2014. https://medium.com/@ramykhuffash/the-1-rule-and-why-it-still-matters-ba0e40bbbffb#au9s8e8v2
“The Logged Out User (continued).” Fred Wilson, AVC.com. September 9, 2011. http://avc.com/2011/09/the-logged-out-user-continued/
“Snapchat updates Discover and Live Stories with new tiles and subscriptions.” Garett Sloane, Digiday. June 7, 2016. http://digiday.com/platforms/snapchat-updates-discover-live-stories-new-tiles-subscriptions/
“Two million people streamed the NFL on Twitter last night and loved it.” Fitz Tepper, TechCrunch. September 16, 2016. https://techcrunch.com/2016/09/16/two-million-people-streamed-the-nfl-on-twitter-last-night-and-loved-it/
“Bootstrap Your Network With A High Value Niche Use Case.” Fred Wilson, AVC.com. July 23, 2015. http://avc.com/2015/07/bootstrap-your-network-with-a-high-value-niche-use-case/
“3 Ways YouTube Pre-Roll Is Forcing Marketers to Rethink Video Advertising.” Kavvi Gupta, Contently.com. March 12, 2015. https://contently.com/strategist/2015/03/12/3-ways-youtube-pre- roll-is-forcing-marketers-to-rethink-video-advertising/
“Why Those “Annoying” YouTube Pre-Roll Ads Actually Work.” Chris Finan, CMG Local Solutions. October 5, 2015. http://blog.cmglocalsolutions.com/why-those-annoying-youtube-pre-roll-ads-actually-work
Chapter 5
“Why No One Uses the Corporate Social Network.” Charlene Li, Harvard Business Review. April 7, 2015. https://hbr.org/2015/04/why-no-one-uses-the-corporate-social-network
“In Defense Of Free.” Fred Wilson, AVC.com. July 15, 2012. http://avc.com/2012/07/in-defense-of-free/
Chapter 6
“Feb 16, 1978: Bulletin Board Goes Electronic.” Scott Gilbertson, Wired. February 16, 2010. https://www.wired.com/2010/02/0216cbbs-first-bbs-bulletin-board/
“A complete history of the rise and fall — and reincarnation! — of the beloved ’90s chatroom.” Caitlin Dewey, The Washington Post. October 30, 2014. https://www.washingtonpost.com/news/the-intersect/wp/2014/10/30/a-complete-history-of-the-rise-and-fall-and-reincarnation-of-the-beloved-90s-chatroom/
“Upvote: This week on Reddit, we watch our step.” Kevin Morris, The Daily Dot. October 28, 2011. http://www.dailydot.com/society/upvote-week-in-reddit-growth-gameswap/
“Cheating and deception are at Reddit’s core, founder reveals.” Tom Cheredar VentureBeat. June 22, 2012. http://venturebeat.com/2012/06/22/reddit-fake-users/
“Details Emerge About Victoria Taylor’s Dismissal at Reddit.” Mike Isaac, The New York Times. July 13, 2015. http://bits.blogs.nytimes.com/2015/07/13/details-emerge-about-victoria-taylors-dismissal-at-reddit/?_r=1
Chapter 7
“Diligence at Social Capital Part 2: Accounting for Revenue Growth.” Jonathan Hsu, Medium. September 28, 2015. https://medium.com/swlh/diligence-at-social-capital-part-2-accounting-for-revenue-growth-551fa07dd972#a5ggas5u6
“Use this spreadsheet for churn, MRR, and cohort analysis.” Christoph Janz, AndrewChen.com http://andrewchen.co/the-easiest-spreadsheet-for-churn-mrr-and-cohort-analysis-guest-post/
“Diligence at Social Capital Part 1: Accounting for User Growth.” Jonathan Hsu, Medium. September 22, 2015. https://medium.com/swlh/diligence-at-social-capital-part-1-accounting-for-user-growth-4a8a449fddfc#4rbqcpm62
“What Is Viral Coefficient And Why You Need It To Make Your App Go Viral.” Laxman Papineni, AppVirality Blog. February 2014. http://www.appvirality.com/blog/what-is-viral-coefficient-and-why-you-need-it-to-make-your-app-go-viral/
“Lessons Learned – Viral Marketing.” David Skok, For Entrepreneurs. http://www.forentrepreneurs.com/lessons-learnt-viral-marketing/
Chapter 8
“Here’s How Fast Internet Companies Need To Grow To Get Public.” Mahesh Vellanki, Mahesh-vc.com. July 6, 2016. http://www.mahesh-vc.com/blog/heres-how-fast-internet-companies-need-to-grow-to-get-public
“Line Corp IPO: Where Does It Stack Up Against Past Social & Messaging Exits?” CB Insights. July 14, 2016. https://www.cbinsights.com/blog/top-social-messaging-startup-exits-line-ipo
“Here Is How You Really Value Snapchat, Instagram and Other Big Consumer Apps.” Mahesh Vellanki, Mahesh-vc.com. July 30, 2015. http://www.mahesh-vc.com/blog/here-is-how-you-really-value-snapchat-instagram-and-other-big-consumer-apps
Chapter 9
“The Spawn of Facebook Groups.” Teddy Citrin, Medium. September 15, 2015. https://medium.com/@tcitrin/the-spawn-of-facebook-groups-efcbee9e6655#r8cl6m78h
“Crypto Tokens and the Coming Age of Protocol Innovation.” Albert Wenger, Continuations. July 28, 2016. http://continuations.com/post/148098927445/crypto-tokens-and-the-coming-age-of-protocol
“Five Forecasts For The Future.” Scott Belsky, Medium. October 26, 2016. https://medium.com/@scottbelsky/five-forecasts-for-the-future-3c388f33e69f#fyocj757n